Grafana is Slow. How to make it faster.
Grafana is Slow
Around the web you will find reports of Grafana being slow similar to those shown below, this article tells you how to make grafana faster:
- "Grafana dashboard panel is taking 5 to 8 seconds to load"
- Large query takes forever to load
- Is there anything we can do to improve performance? Grafana dashboards are taking a very long time to populate
- Very slow performance / connection errors
What is Slow?
First do some investigation and thinking:
- How long is it taking to load a dashboard?
- How many panels do you have in the dashboard?
- How many data points does each query return? (date range? sampling rate?)
- What is your back-end data source?
- Is your grafana server at max capacity? (CPU/RAM)
- Is your data source server at max capacity? (CPU/RAM)
- Network bandwidth/latency between Grafana and the data source?
- Network bandwidth/latency between Grafana and the client?
- If you run the queries outside grafana, are they slow there too?
- Has performance only recently got worse? What changed? (Upgrade? Server? Panels?)
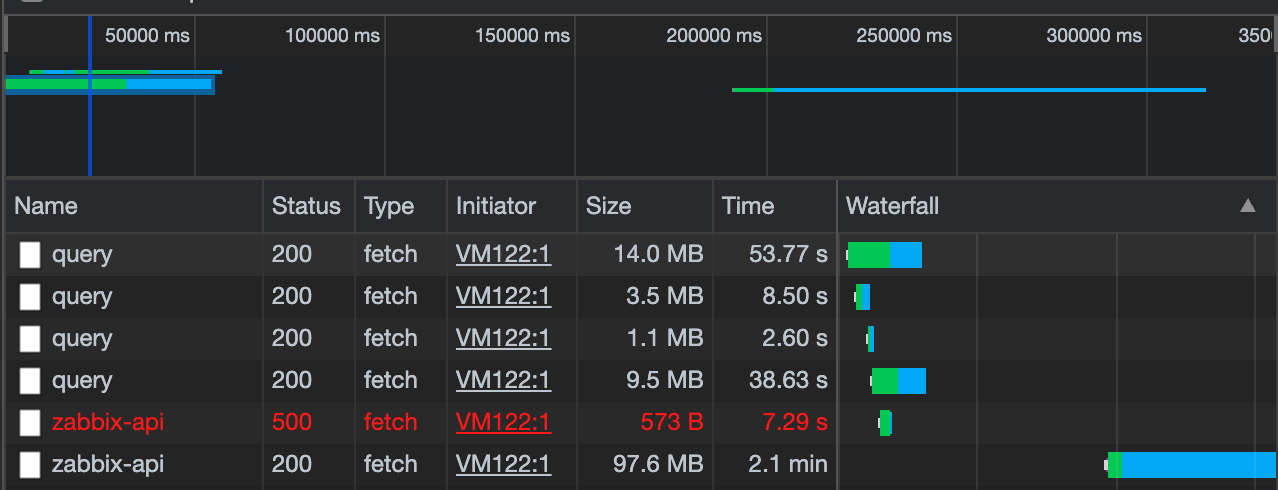
Example chrome web dev tools showing grafana queries:
Resolving Slow Database
The easiest way to speed up queries is to pull less data, less often, consider:
- Reducing the time range. If not all panels need the full time range, modify the slow ones to pull a smaller time range. e.g. Most charts show the last week, modify the slow ones to fetch the last day of data.
- Hide some panels on startup. "Rows can be added the same way as panels and will add a small header like structure. A click on that allows you to collapse all its content. Using these rows not only makes your dashboard more structured but can also make it faster as Grafana only loads data currently visible (with some small exceptions)."
- Cache the data. If your dashboard shows data from last week you probably don't need to reload it every minute, fifteen minutes will suffice lower server load 15x.
- Down-Sample Data - Instead of pulling 1 minute bar data over a week, pull hourly data. If users don't zoom in, they won't notice a difference
- Change Databases - This is a drastic step but benchmarks show some databases are 100x faster than others. If time is money for your project, you may want to consider paying for a high performance database.
Common Issues
My dashboard is empty, not even empty graphs
If you load Grafana dashboard and you don't see any panels or graphs just the sidebar (as shown on this picture image ) it means your templating variables values takes long time to load. Your dashboard won't load until all the variable values are obtained.