
Pulse - Interactive Table Clicks
We are going to create an interactive table and graph visualization.
When we click a row of the table, the graph is updated to show data for that item.
Creating an Interactive Application
Creating Table
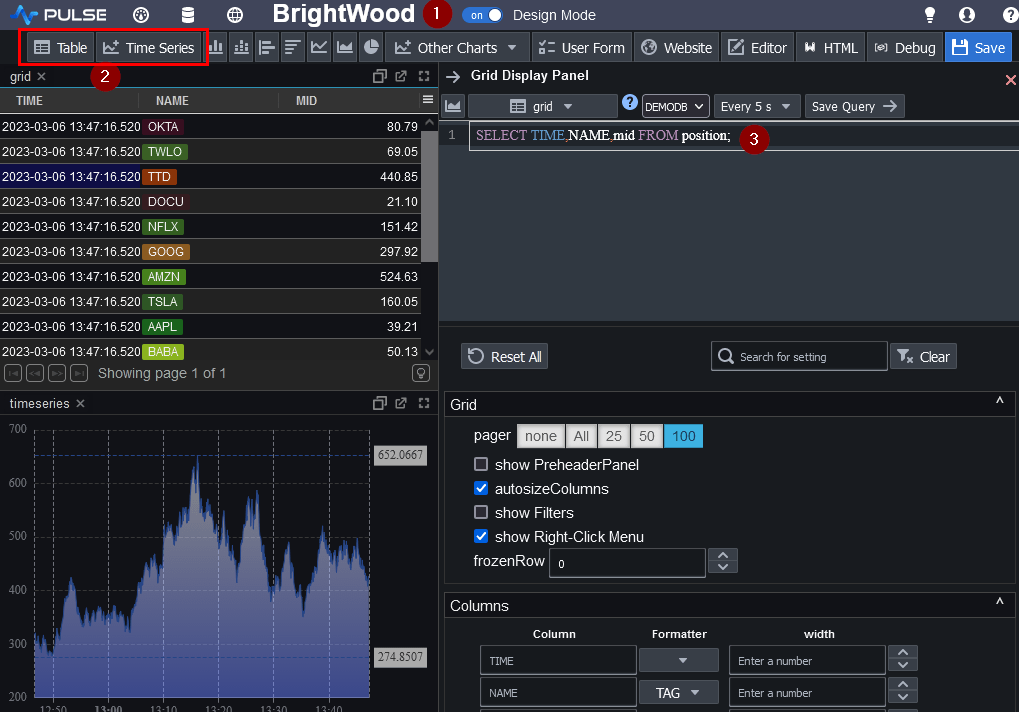
- Make sure you are in design mode
- Click the component bar to add either a table or time-series chart, then click again to place it into a location.
- Update the SQL query, then press Ctrl+e or click save to update the table.
Adding a Graph
Linking the Table and Graph
Rather than hard-coding 'NFLX', update the graph query to use the {name} variable.