The Data Pyramid is a Lie
If you work with data, at some point you will be presented with a powerpoint similar to this:
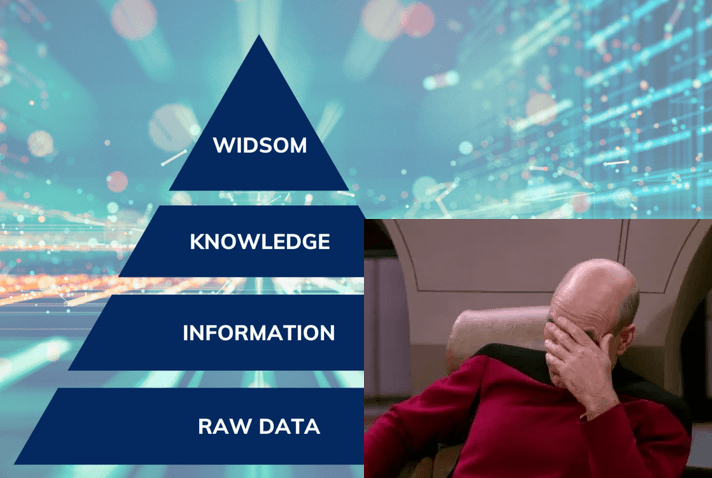
A wonderful fictional land, where we cleanly build everything on the layer below until we reach the heavens (In the past this was wisdom or visualization, increasingly it’s mythical AI).
There are two essential things missing from this:
- At the end of every data sequence, should be an Action.
If there isn’t, what are we even attempting to do?
Wisdom – should lead to action. A visualization or email alert should prompt Action. But there MUST always be action. - At every stage, there is feedback. It’s a cycle not a mythical pyramid or promised land.
I’ve never met anyone working with data, that didn’t find something out at a later stage that meant having to go back and rework their previous steps.
e.g.- Looking at the average height of males, The United States shows 5.5m, oops I guess I better go back and interpret that as feet instead of metres.
- Based on analysis, you tried emailing a subset of customers that should have converted to paying customers at 5% rate, but they didn’t. So based on action, you discovered you were wrong. Time to go back to the start and examine why.
Therefore the diagram should look more like this:
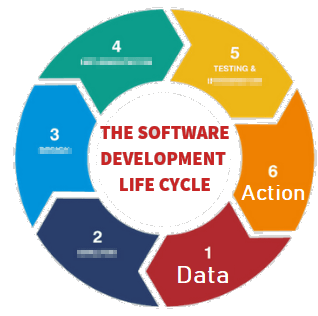
You start with data, you reach Action but at any stage, including after action you can loop back to earlier stages in the cycle.
I’ve purposely blurred out the steps because it doesn’t matter what’s inbetween. Inbetween should be whatever gets your team to the action quickest with the acceptable level of risk. Notice this is the SDLC software development lifecycle. Software people spent years learning this lesson and it’s still an ongoing effort to make it a proper science.
What do you think? Am I wrong?