Binance Streaming Connection
For a step by step video guide, see our Binance Depthmap tutorial.
Adding a Binance Connection
Currently to create a subscription you should:
- Create a "Binance" connection type.
- Specify that connection as a source and set the query. e.g.
{"method": "SUBSCRIBE","params":["btcusdt@depth"],"id": 3} - The query format is exactly as detailed in the Binance API.
For every unique subscription including query the server will:
- Open a websocket connection to binance.
- Send the subscription query.
- Await incoming data and forward results to the application.
- Keep the connection open until the application is closed.
Currently the binance connection can only process depth, trade and agTrade subscriptions.
The data from Binance is converted to Market Data Format to allow easy visualization.
Streaming Data Append
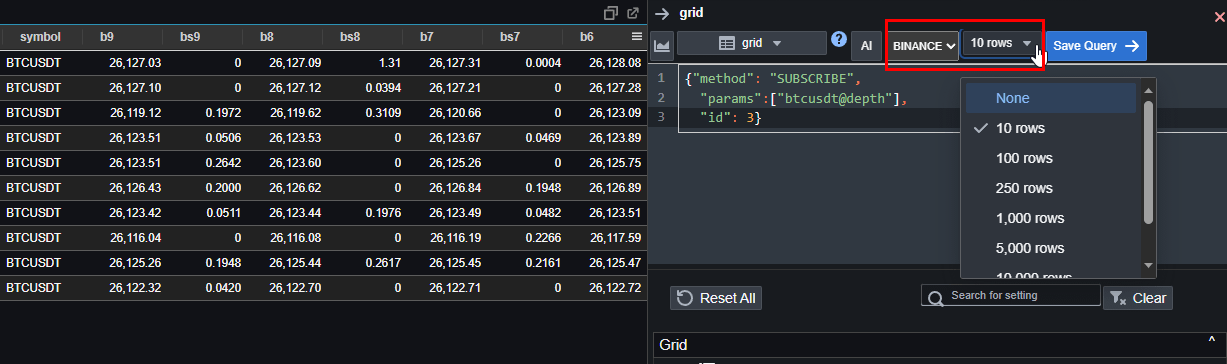
If you select a streaming data source such as Binance, you can ask Pulse to append the incoming data on the client side. Click on the dropdown in the query definition area and select the number of rows you would like to append. Once it reaches the specified row limit, it will remove the oldest entries to maintain a constant number of rows.
Variables to control subscriptions
One issue with variables and Binance subscriptions is that the instrument is commonly contained within speech marks " and
pulse tries to add more. To prevent this you should use {{varname:raw}} to specify the raw formatter, so that only the value is inserted.
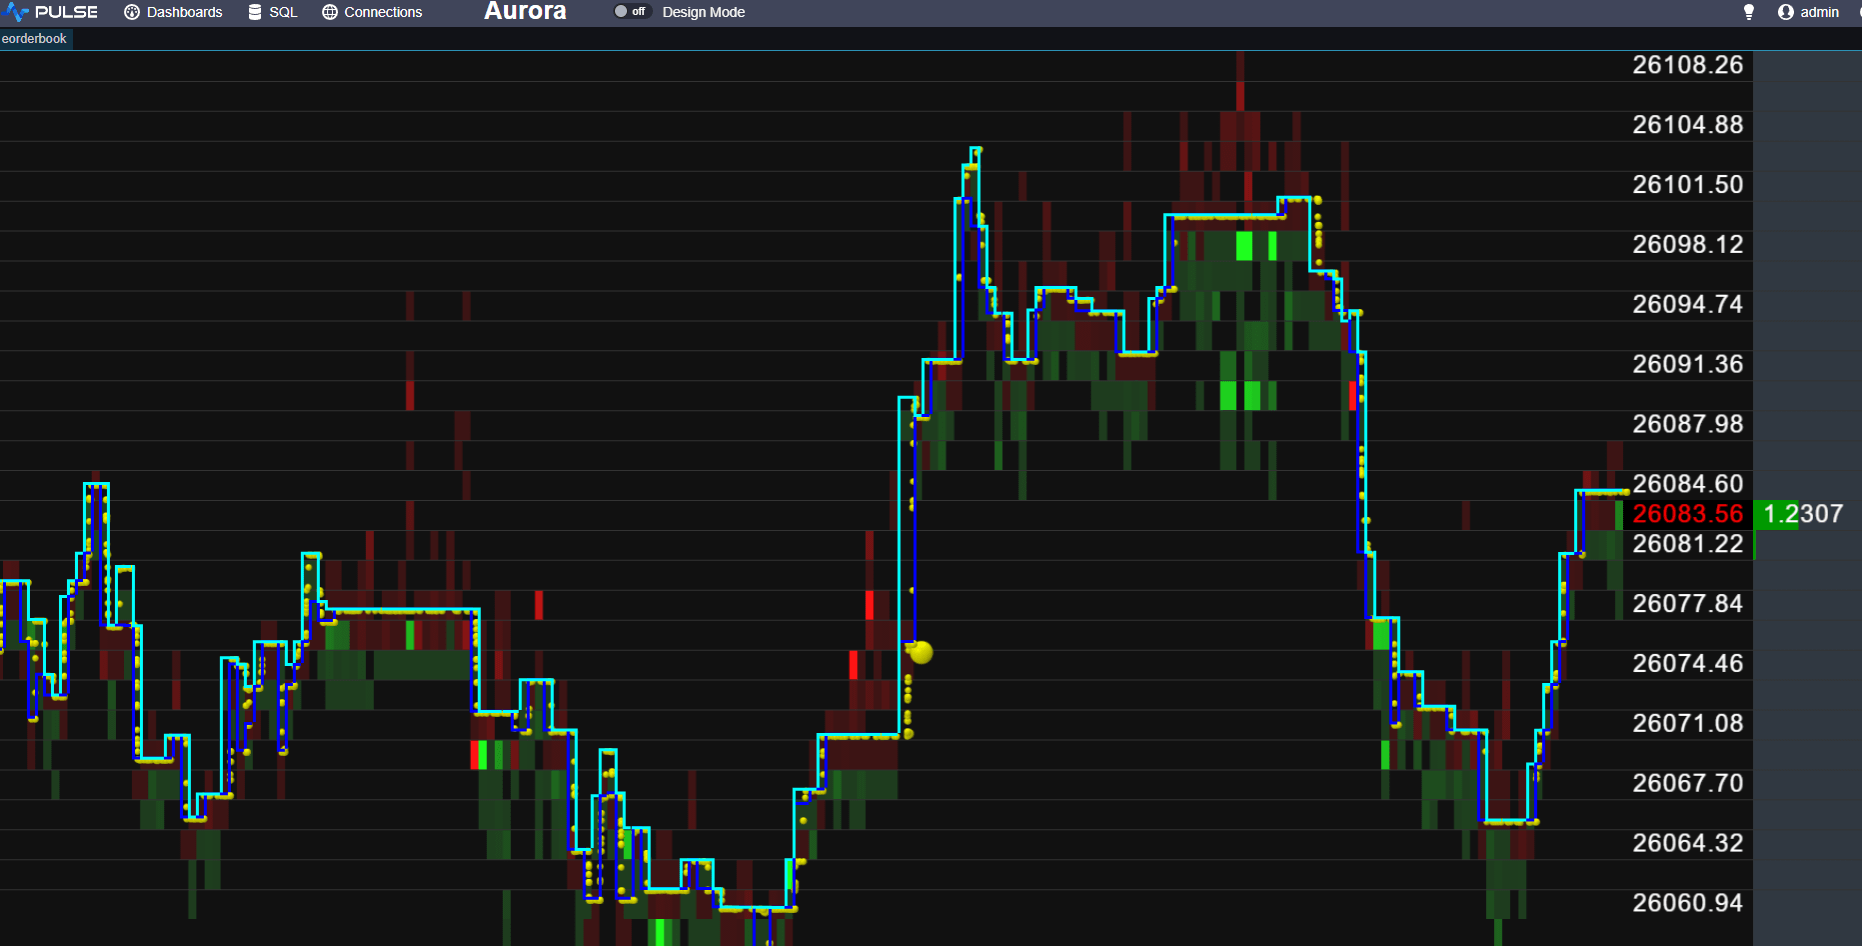
Order Book Visualization
The data from Binance is converted to Market Data Format to allow easy visualization.
Order Book Heatmap Visualization
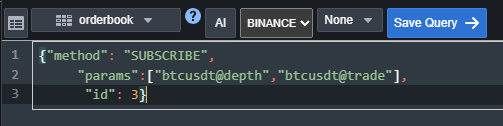
Binance data can be viewed using the specialized orderbook visualization:
{"method": "SUBSCRIBE", "params":["btcusdt@depth","btcusdt@trade"], "id": 5}
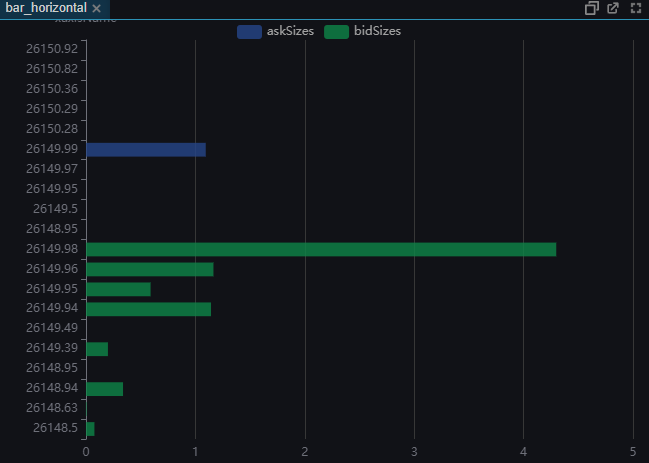
Bar / Stack / Line Chart
If you select stacked bar chart for viewing binance depth data, it will create the common bid vs ask chart:
{"method": "SUBSCRIBE","params":["btcusdt@depth"],"id": 3}
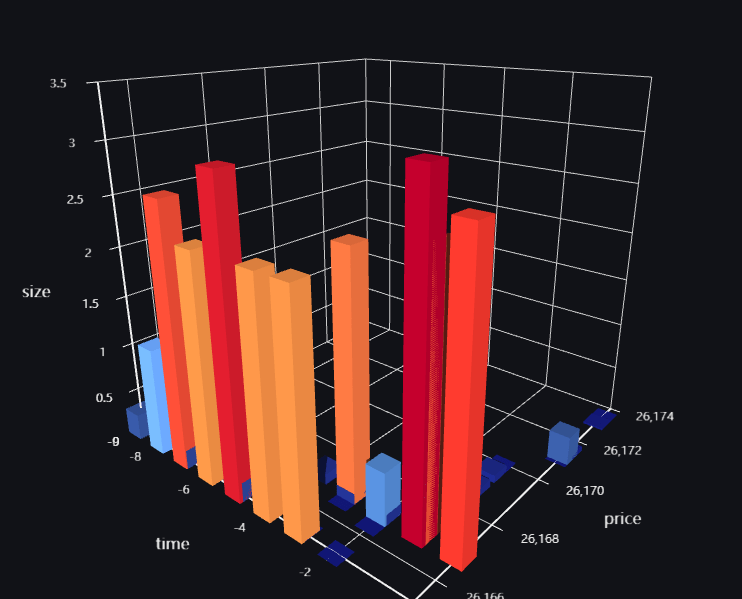
3DBar of Asks
If you select 3D bar chart, it will create a 3D bar chart of the ask prices vs size over time:
{"method": "SUBSCRIBE","params":["btcusdt@depth"],"id": 3}