kdb 3.5 Released with Stack Trace
kdb+ 3.5 had a significant number of changes:
- Debugger – At long last we can finally get stack traces when errors occur.
- Concurrent Memory Allocator – Supposedly better performance when returning large results from peach
- Port Reuse – Allow multiple processes to listen on same port. Assuming Linux Support
- Improved Performance – of Sorting and Searching
- Additional ujf function – Similar to uj from v2.x fills from left hand side
kdb Debugger
The feature that most interests us right now is the Debugging functionality. If you are not familiar with how basic errors, exceptions and stack movement is handled in kdb see our first article on kdb debugging here. In this short post we will only look at the new stack trace functionality.
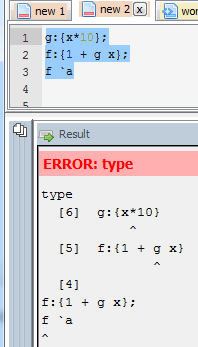
Now when you run a function that causes an error at the terminal you will get the stack trace. Here’s a simple example where the function f fails:
Whatever depth the error occurs at we get the full depth stack trace, showing every function that was called to get there using .Q.bt[]:
The good news is that this same functionality is availabe in qStudio 1.43. Give it a try: qStudio.
Note: the ability to show stack traces relies on qStudio wrapping every query you send to the server with its own code to perform some analysis and return those values. By default wrapping is on as seen in preferences. If you are accessing a kdb server ran by someone else you may have to turn wrapping off as that server may limit which queries are allowed. Unfortunately stack tracing those queries won’t be easily possible.
That’s just the basics, there are other new exposed functions and variables, such as .Q.trp – for trapping calls and accessing traces that we are going to look at in more detail in future.