RSI Relative Strength Index in Kdb
In this tutorial we are going to recreate this example RSI calculation in q, the language of the kdb database.
The relative strength index (RSI) is a technical indicator used in the analysis of financial markets. It is intended to chart the current and historical strength or weakness of a stock or market based on the closing prices of a recent trading period. The RSI is classified as a momentum oscillator, measuring the velocity and magnitude of directional price movements. Momentum is the rate of the rise or fall in price.
The RSI computes momentum as the ratio of higher closes to lower closes: stocks which have had more or stronger positive changes have a higher RSI than stocks which have had more or stronger negative changes. The RSI is most typically used on a 14 day timeframe, measured on a scale from 0 to 100, with high and low levels marked at 70 and 30, respectively. Shorter or longer timeframes are used for alternately shorter or longer outlooks. More extreme high and low levels—80 and 20, or 90 and 10—occur less frequently but indicate stronger momentum.
.
Stock Price Time-Series Data
We are going to use the following example data, you can download the csv here or the excel version here.
| Date | QQQQ Close | Change | Gain | Loss | Avg Gain | Avg Loss | RS | 14-day RSI |
|---|---|---|---|---|---|---|---|---|
| 2009-12-14 | 44.34 | |||||||
| 2009-12-15 | 44.09 | -0.25 | 0.00 | 0.25 | ||||
| 2009-12-16 | 44.15 | 0.06 | 0.06 | 0.00 | ||||
| 2009-12-17 | 43.61 | -0.54 | 0.00 | 0.54 | ||||
| 2009-12-18 | 44.33 | 0.72 | 0.72 | 0.00 | ||||
| 2009-12-21 | 44.83 | 0.50 | 0.50 | 0.00 | ||||
| 2009-12-22 | 45.10 | 0.27 | 0.27 | 0.00 | ||||
| 2009-12-23 | 45.42 | 0.33 | 0.33 | 0.00 | ||||
| 2009-12-24 | 45.84 | 0.42 | 0.42 | 0.00 | ||||
| 2009-12-28 | 46.08 | 0.24 | 0.24 | 0.00 | ||||
| 2009-12-29 | 45.89 | -0.19 | 0.00 | 0.19 | ||||
| 2009-12-30 | 46.03 | 0.14 | 0.14 | 0.00 | ||||
| 2009-12-31 | 45.61 | -0.42 | 0.00 | 0.42 | ||||
| 2010-01-04 | 46.28 | 0.67 | 0.67 | 0.00 | RS | RSI | ||
| 2010-01-05 | 46.28 | 0.00 | 0.00 | 0.00 | 0.24 | 0.10 | 2.39 | 70.53 |
| 2010-01-06 | 46.00 | -0.28 | 0.00 | 0.28 | 0.22 | 0.11 | 1.97 | 66.32 |
| 2010-01-07 | 46.03 | 0.03 | 0.03 | 0.00 | 0.21 | 0.10 | 1.99 | 66.55 |
| 2010-01-08 | 46.41 | 0.38 | 0.38 | 0.00 | 0.22 | 0.10 | 2.27 | 69.41 |
| 2010-01-11 | 46.22 | -0.19 | 0.00 | 0.19 | 0.20 | 0.10 | 1.97 | 66.36 |
| 2010-01-12 | 45.64 | -0.58 | 0.00 | 0.58 | 0.19 | 0.14 | 1.38 | 57.97 |
| 2010-01-13 | 46.21 | 0.57 | 0.57 | 0.00 | 0.22 | 0.13 | 1.70 | 62.93 |
| 2010-01-14 | 46.25 | 0.04 | 0.04 | 0.00 | 0.20 | 0.12 | 1.72 | 63.26 |
| 2010-01-15 | 45.71 | -0.54 | 0.00 | 0.54 | 0.19 | 0.15 | 1.28 | 56.06 |
| 2010-01-19 | 46.45 | 0.74 | 0.74 | 0.00 | 0.23 | 0.14 | 1.66 | 62.38 |
| 2010-01-20 | 45.78 | -0.67 | 0.00 | 0.67 | 0.21 | 0.18 | 1.21 | 54.71 |
| 2010-01-21 | 45.35 | -0.43 | 0.00 | 0.43 | 0.20 | 0.19 | 1.02 | 50.42 |
| 2010-01-22 | 44.03 | -1.33 | 0.00 | 1.33 | 0.18 | 0.27 | 0.67 | 39.99 |
| 2010-01-25 | 44.18 | 0.15 | 0.15 | 0.00 | 0.18 | 0.26 | 0.71 | 41.46 |
| 2010-01-26 | 44.22 | 0.04 | 0.04 | 0.00 | 0.17 | 0.24 | 0.72 | 41.87 |
| 2010-01-27 | 44.57 | 0.35 | 0.35 | 0.00 | 0.18 | 0.22 | 0.83 | 45.46 |
| 2010-01-28 | 43.42 | -1.15 | 0.00 | 1.15 | 0.17 | 0.29 | 0.59 | 37.30 |
| 2010-01-29 | 42.66 | -0.76 | 0.00 | 0.76 | 0.16 | 0.32 | 0.49 | 33.08 |
| 2010-02-01 | 43.13 | 0.47 | 0.47 | 0.00 | 0.18 | 0.30 | 0.61 | 37.77 |
RSI Formulas
The formulas behind the calculations used in the table are:
- First Average Gain = Sum of Gains over the past 14 periods / 14.
- First Average Loss = Sum of Losses over the past 14 periods / 14
All subsequent gains than the first use the following:
- Average Gain = [(previous Average Gain) x 13 + current Gain] / 14.
- Average Loss = [(previous Average Loss) x 13 + current Loss] / 14.
- RS = Average Gain / Average Loss
- RSI = 100 – 100/(1+RS)
Writing the Analytic in q
We can load our data (rsi.csv) in then apply updates at each step to recreate the table above:
Code kindly donated by Terry Lynch
Rather than create all the intermediate columns we can create a calcRsi function like so:
Finally we can visualize our data using the charting functionality of qStudio (an IDE for kdb):
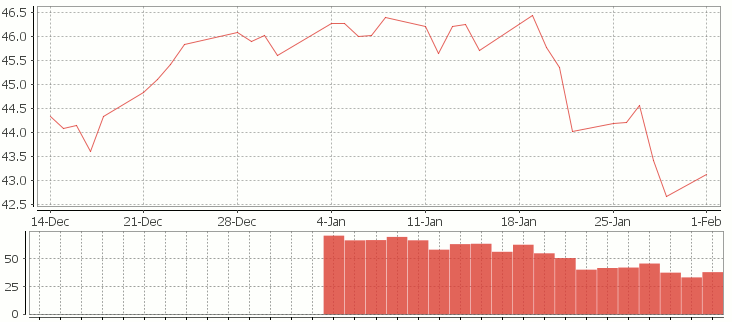
RSI Relative Strength Index stock chart for QQQQ created using qStudio
Or to plot RSI by itself (similar to original article
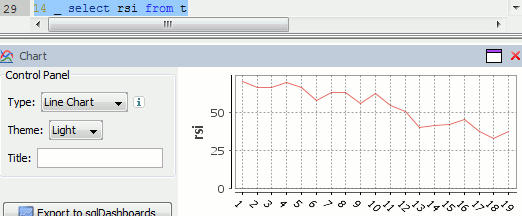
RSI Line Graph in qStudio
Writing kdb analytics such as Relative Strength Index is covered in our kdb training course, we offer both public kdb training courses in New York, London, Asia and on-site kdb courses at your offices, tailored to your needs.
The final code snippet is wrong. To double-check it’s wrong, run it on any data
calcRsi[14;y]; / for some y
and then also run it on
calcRsi[14;(14#y),(99999+14_y)];
to notice that the function will give the same result
Be careful about using this RSI function as a signal, as you may end using the future to predict the past