
Creating Live QuestDB Crypto Charts
We are going to create a Pulse sql Application to display live data from a QuestDB database.
QuestDB is an open-source "Columnar time-series database with high performance ingestion and SQL analytics".
Contents
Creating new QuestDB Database
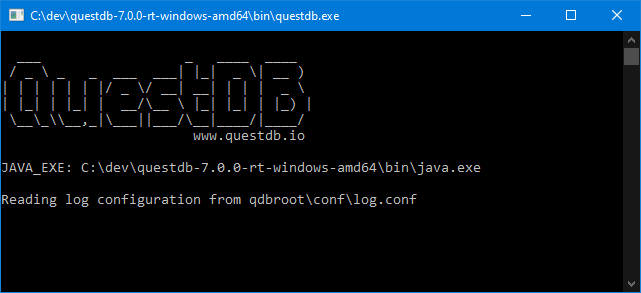
QuestDB is an open-source "Columnar time-series database with high performance ingestion and SQL analytics". It's extremely small, fast and great at time-series queries. Download it then start questdb.exe up to give you this console:
Add QuestDB PostgreSQL Connection
Quest provides a number of APIs, REST / ILP - InfluxDB Line Protocol and PostgreSQL wire protocol.
For querying we are going to connect to the PostgreSQL on port 8812
Download Pulse
any platform is fine, then launch pulse.exe or pulse-log.sh. This will open the pulse UI in a web browser.
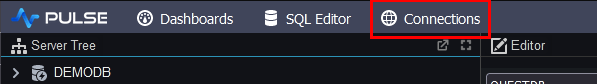
Click Connections to go to the connections screen.
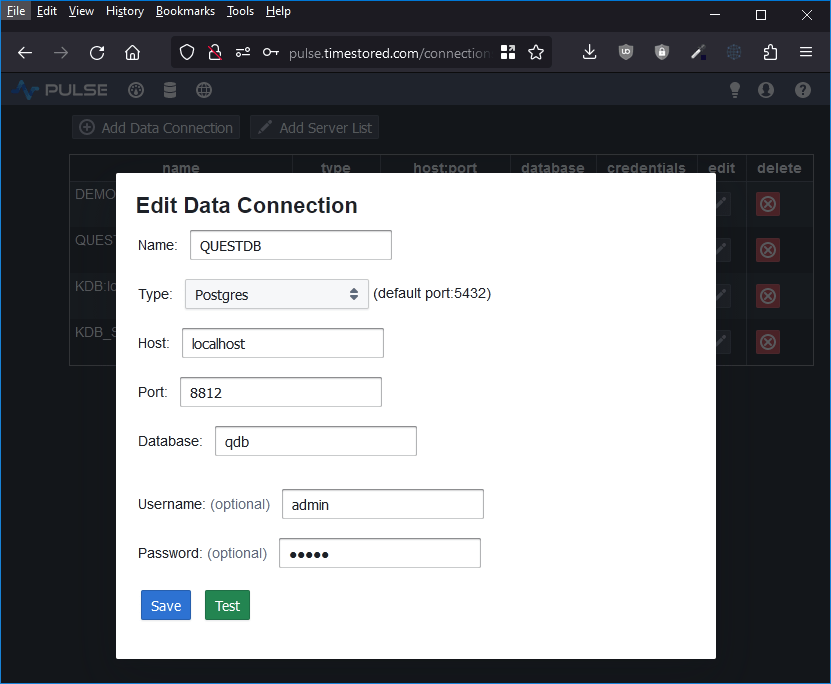
To add a connection in Pulse goto Connections->"Add Data Connection" and fill in your details.
You can try clicking test to see if the connection works before adding it.
- username: admin
- password: quest
- database: qdb
- port: 8812
- host: localhost
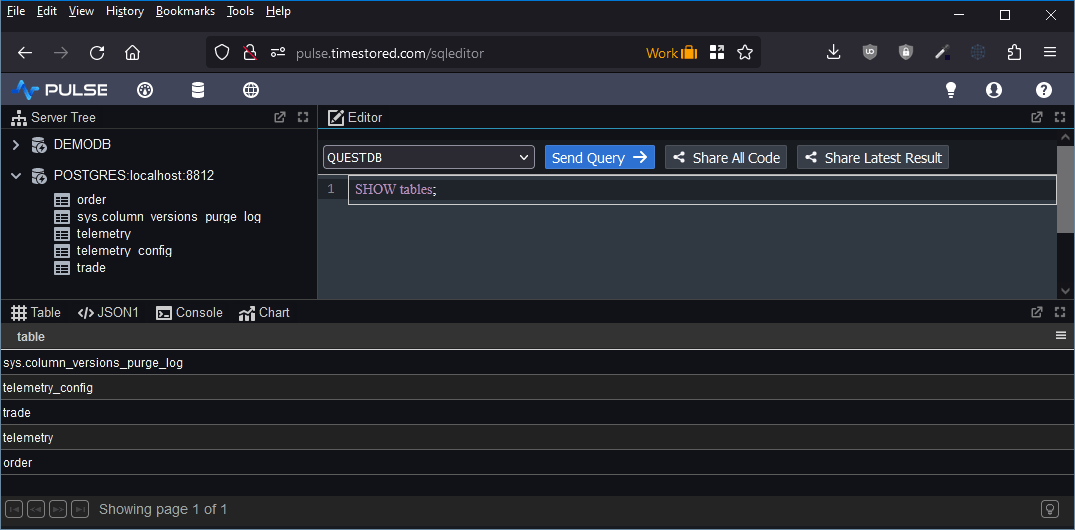
Run the test query "SHOW tables;" to check it works:
Populating the Tables
To populate our tables, we have created a java program that uses org.knowm.xchange to connect to a number of exchanges and forward data to QuestDB using ILP (InfluxDB Line Protocol). To run it yourself, download the jar below or see the source in our github repo. The periods "." are the feed waiting. The larger letters T/o are it sending Trades and Orders respectively.
When you run it, you should see output like this:
For those curious, the important loop of the java code is taking the incoming data and sending it as shown below. Notice we are flushing on a timer for efficiency purposes:
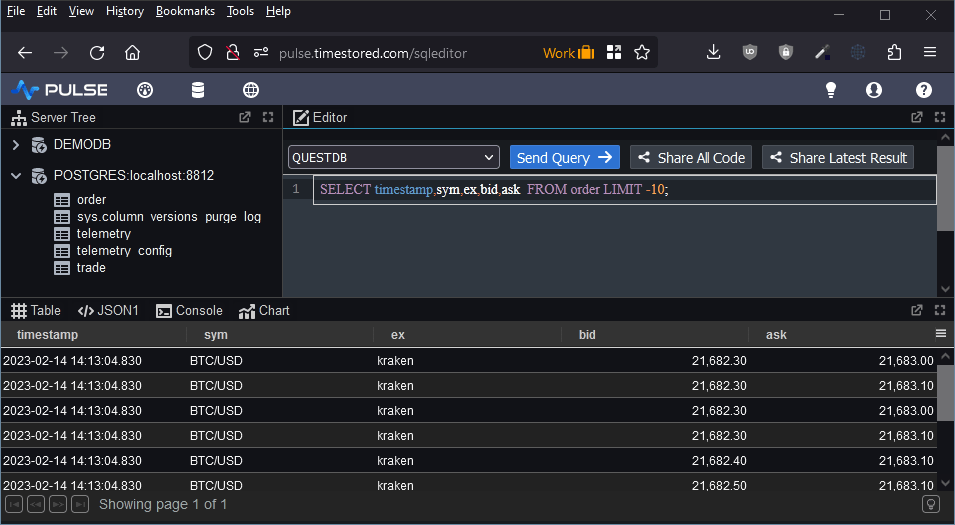
Once data has been ticking a few seconds, go back to the editor and try this query:
SELECT * FROM order LIMIT -10;
Adding our First Table
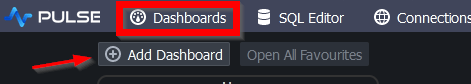
- On the dashboards listing page, click add
- Click on the newly created application to go into it. Either click on edit or toggle design mode once in the application.

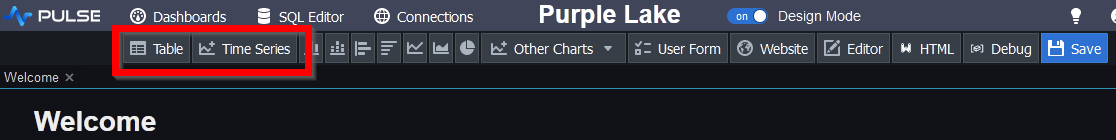
- On the component bar, click "Table" to add a grid.
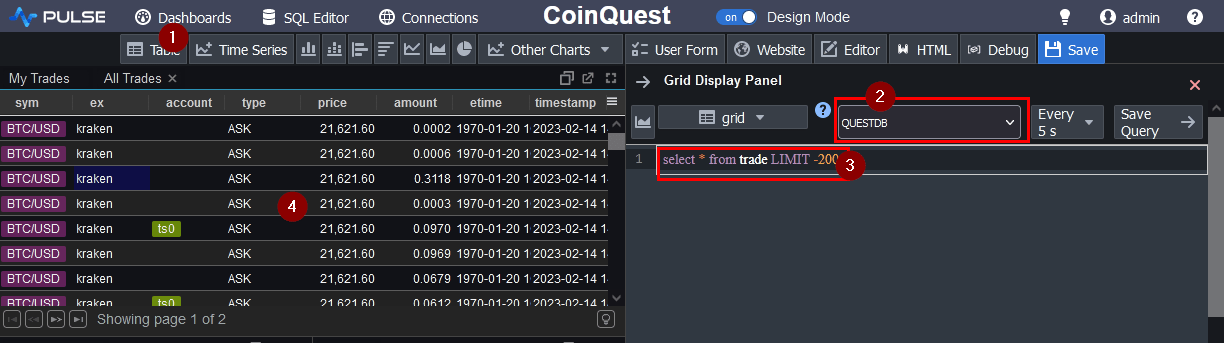
- Within the Editor
- Select the QuestDB server
- Enter the query:
select * from trade LIMIT -200;
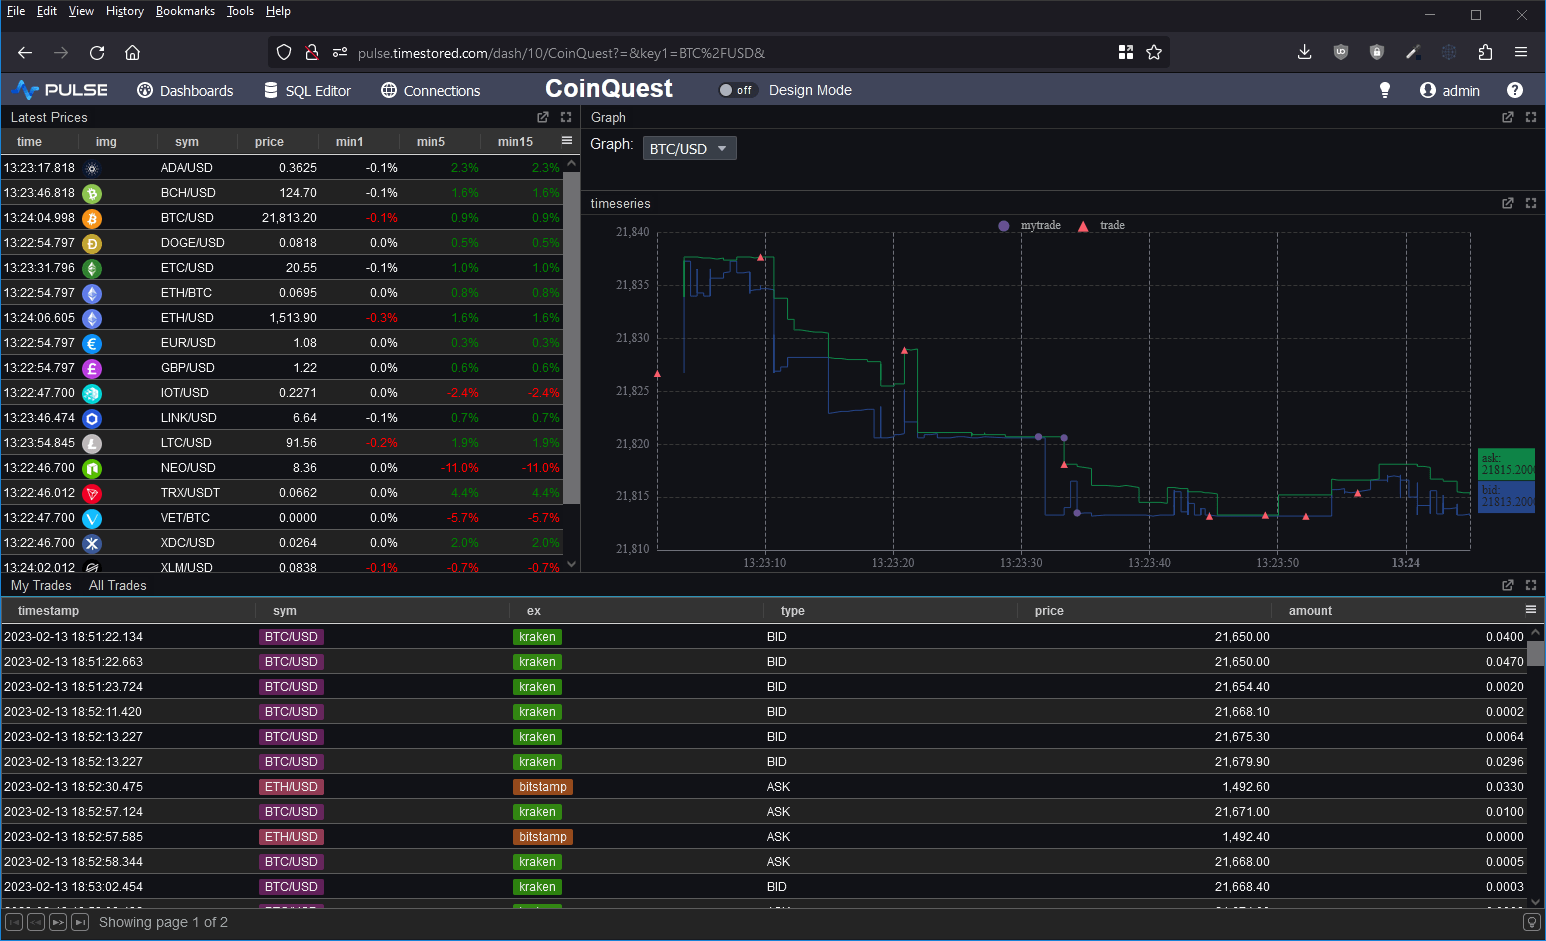
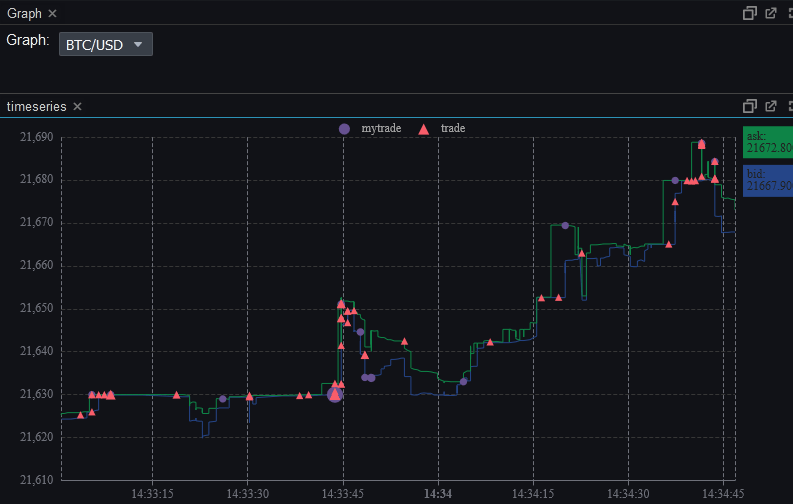
Adding a Chart
The next SQL chart we want is a time-series. We use UNION to join the quotes + my trades + others trades. So that the bid/ask quotes are shown as lines, while the trades have triangle/circle shapes relative to the size of the trade:
User Interaction with Forms
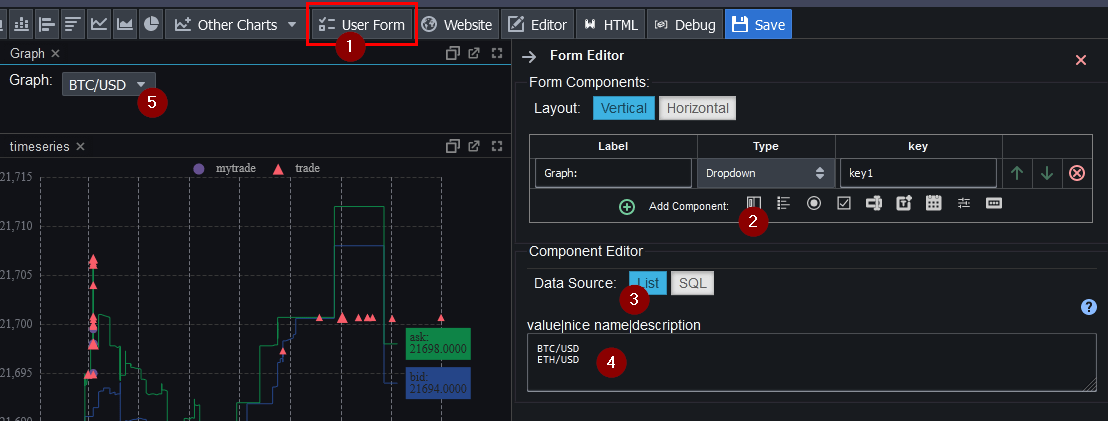
Forms allow user interaction by placing user input within the SQL queries. To create one:
- Click "User Form" on the component bar to add that component.
- Within the Editor, click "Add Component" to add a dropdown component.
- Within the Component Editor, select List as the data source
- Specify the list:
BTC/USD ETH/USD - Click the dropdown button to test it.
Using Form Values in Charts
To use form values in charts, we use the key name surrounded by parentheses e.g. ((key1)).
The SQL code then changes from/to:
SELECT timestamp,bid,ask, FROM order WHERE sym LIKE 'BTC/USD' AND timestamp > timestamp_floor('m',dateadd('m', -1, now()))
SELECT timestamp,bid,ask, FROM order WHERE sym LIKE ((key1)) AND timestamp > timestamp_floor('m',dateadd('m', -1, now()));
Similarly update the other chart queries
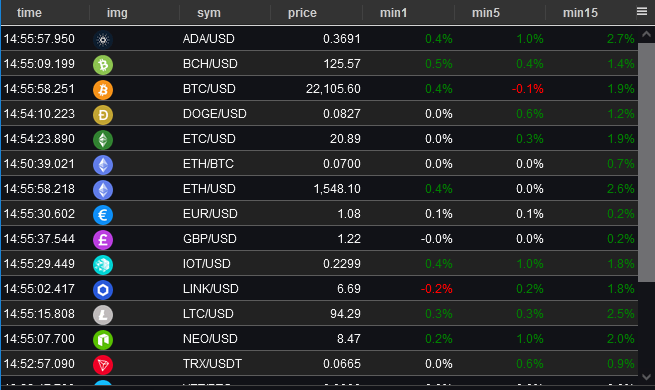
Latest Prices asof 1/5/10 minutes:
So far QuestDB has been fast and easy to use but we haven't really taken advantage of it's features.
One of the coolest things in QuestDB is Latest On queries.
If for example we wanted to show the:
- Latest Price
- Price 1 minute previously
- Price 5 minutes previously
- On the component bar, click "Table" to add a grid.
- Within the Editor
- Select the QuestDB server
- Enter the query:
Well done, we've created our Crypto Application.
I found QuestDB great to work with. It was small, simple very fast and just worked.
In particular I loved the auto-creation of tables and the time-series based join.
I did hit a few niggles and QuestDB has room to improve but on their slack channel, the QuestDB team quickly
answered my queries and the development seems to be moving really fast.
In fact we added it to our top list of time-series databases.
Definitely a database to keep watching for future.
Thanks for watching our demo. Please download Pulse to give it a try for yourself.