
Binance Order Book Visualization
DepthMap
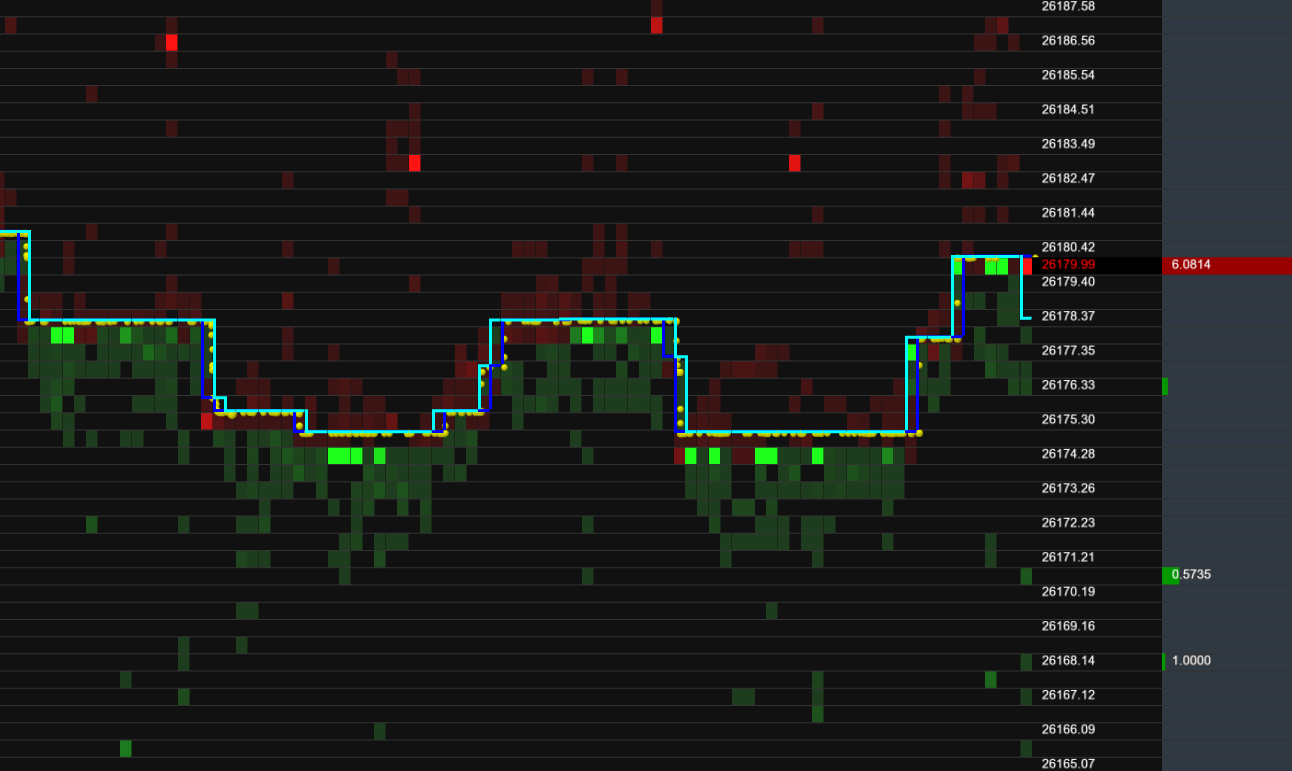
DepthMap charts are a highly specialized visualization for showing level 2 market data. If the data is supplied in a particular format, the current price/size spread over time will be shown as a heatmap like so:
| Component | Description |
|---|---|
| Y-Axis | e.g. 26166 to 26186 on the above image is the price level. This is bitcoin data where most of the quoted prices are around 26170. |
| X-Axis | Time. The rightmost point represents the latest incoming data (usually now). |
| Red Squares | Ask prices, where the red shading represents the size. |
| Green Squares | Bid prices, where the green shading represents the size. |
| Chart Lines | Represent the bid/ask at the top of the book. |
| Yellow Circles | Represent trades that occurred. Their size represents the quantity. |
| Rightmost column with colored bars. | Represent the latest order book received as a bar chart. With the length of bar being the size. |
Specialized Appending
The DepthMap is a highly specialized visualization intended to receive fast appending streams of data and to display that data in real-time. To achieve this, the Depthmap expects incoming data to be appended to previously received data. i.e. If your component is polling, the latest poll result is appended to the previous.
Creating Binance Subscription
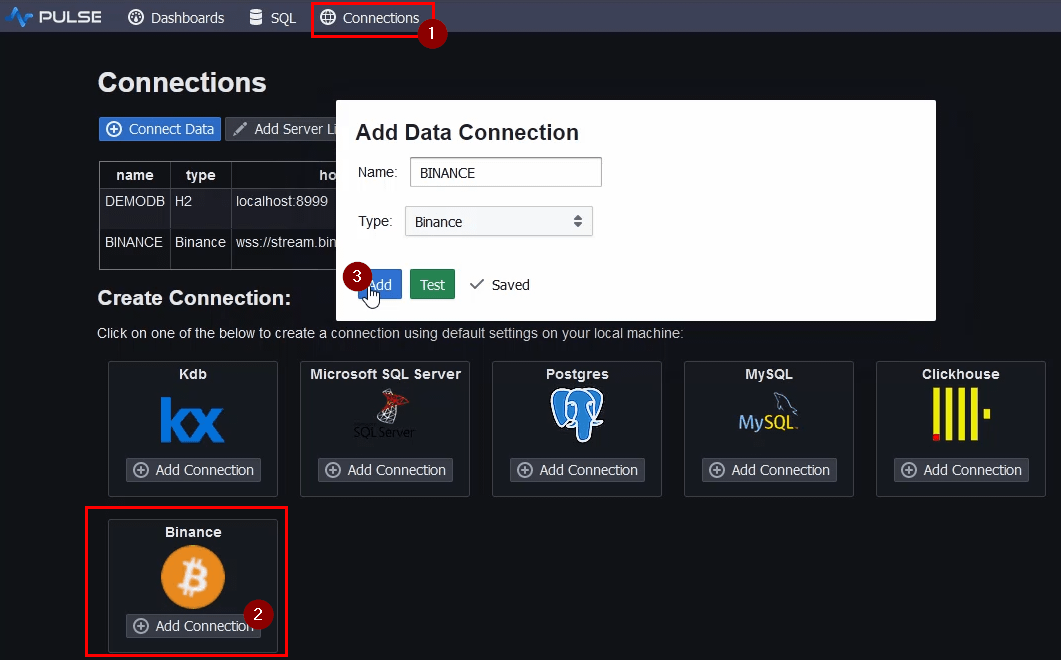
- Go to the Connections page.
- Click Add Connection at the Binance option.
- Confirm Add.
Adding a DepthMap
Create a new application and then:
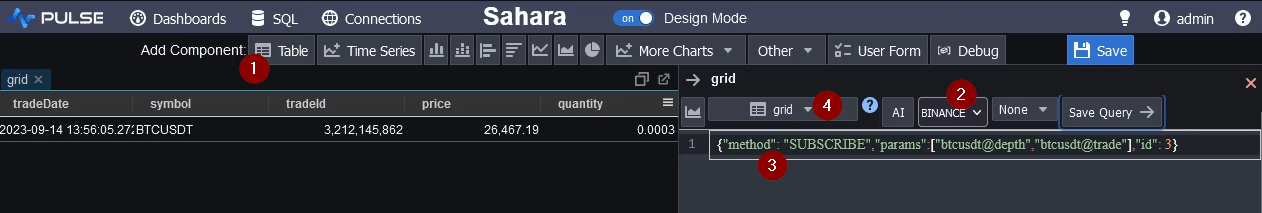
- Add a Table.
- Specify Binance data source.
- Set the subscription query. (given below)
- Change the visualization type to DepthMap.
Congratulations
Congratulations, you have successfully created a streaming DepthMap of bitcoin data.
See our help for more information on any of these topics or our other tutorials to see what else Pulse is capable of.