
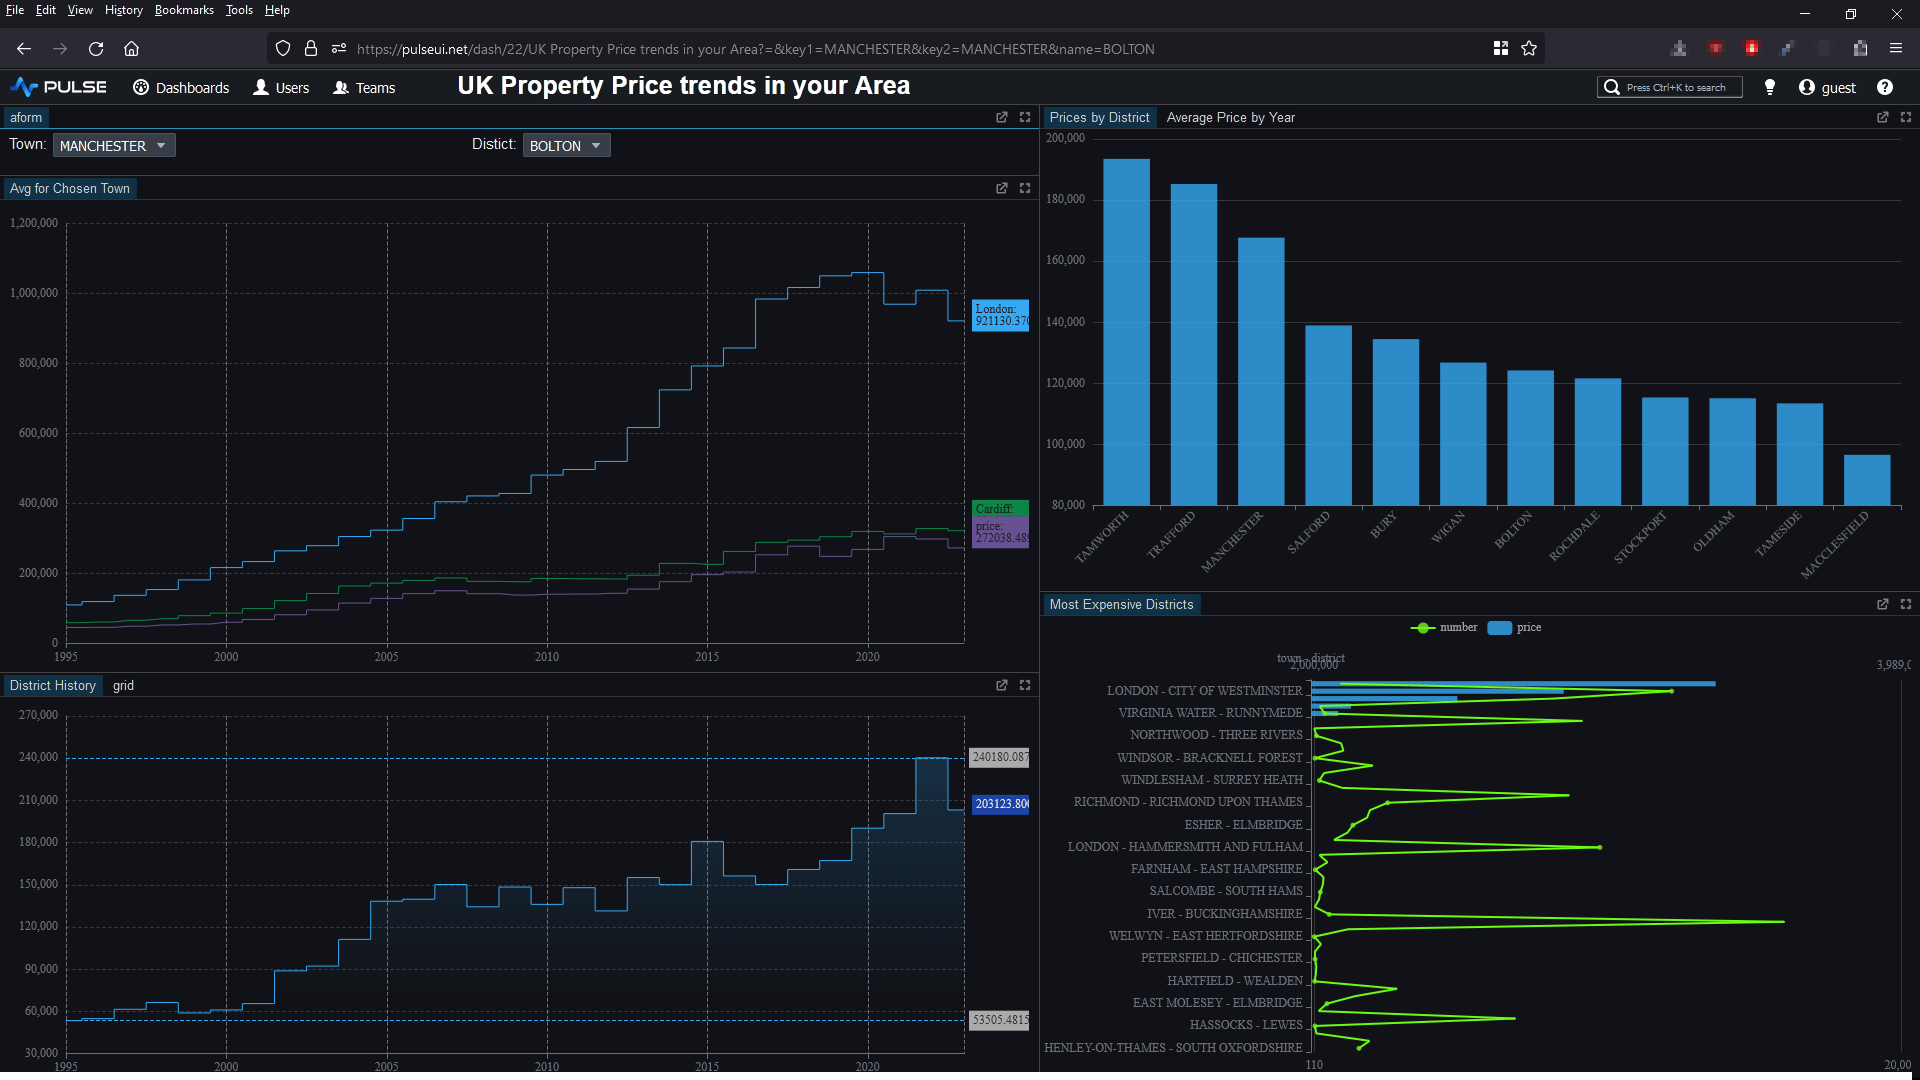
Creating Live Clickhouse Charts
We are going to create a Pulse sql Dashboard to display live data from a Clickhouse database.

Contents
Add Clickhouse Connection
To keep this tutorial, we are going to use the clickhouse play server that they provide and allow the public to connect to.
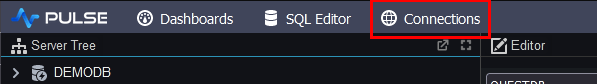
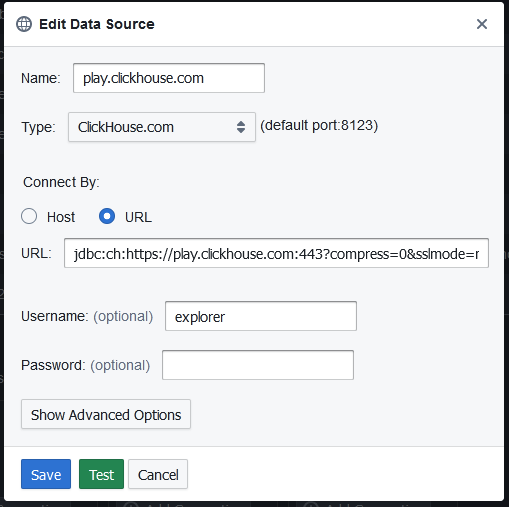
To add a connection in Pulse goto Connections->"Add Data Connection" and fill in your details.
You can try clicking test to see if the connection works before adding it.
- name: play.clickhouse.com
- Type: Clickhouse.com
- Connect by: URL
- URL:
jdbc:ch:https://play.clickhouse.com:443?compress=0&sslmode=none - username: explorer
- password:
Adding our First Table
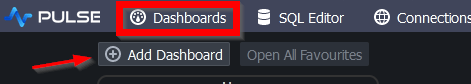
- On the dashboards listing page, click add
- Click on the newly created dashboard to go into it. Either click on edit or toggle design mode once in the dashboard.
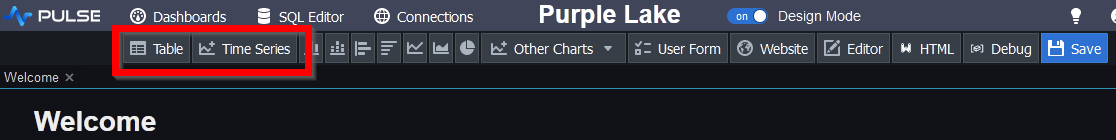
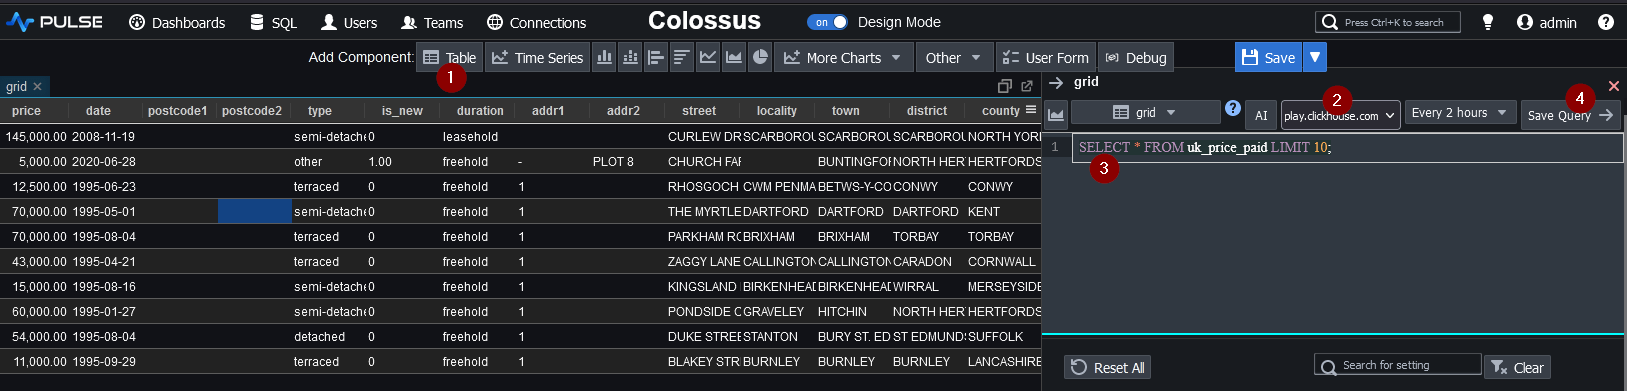
- On the component bar, click "Table" to add a grid.
- Within the Editor
- Select the Clickhouse server
- Enter the query:
SELECT * FROM uk_price_paid LIMIT 10;
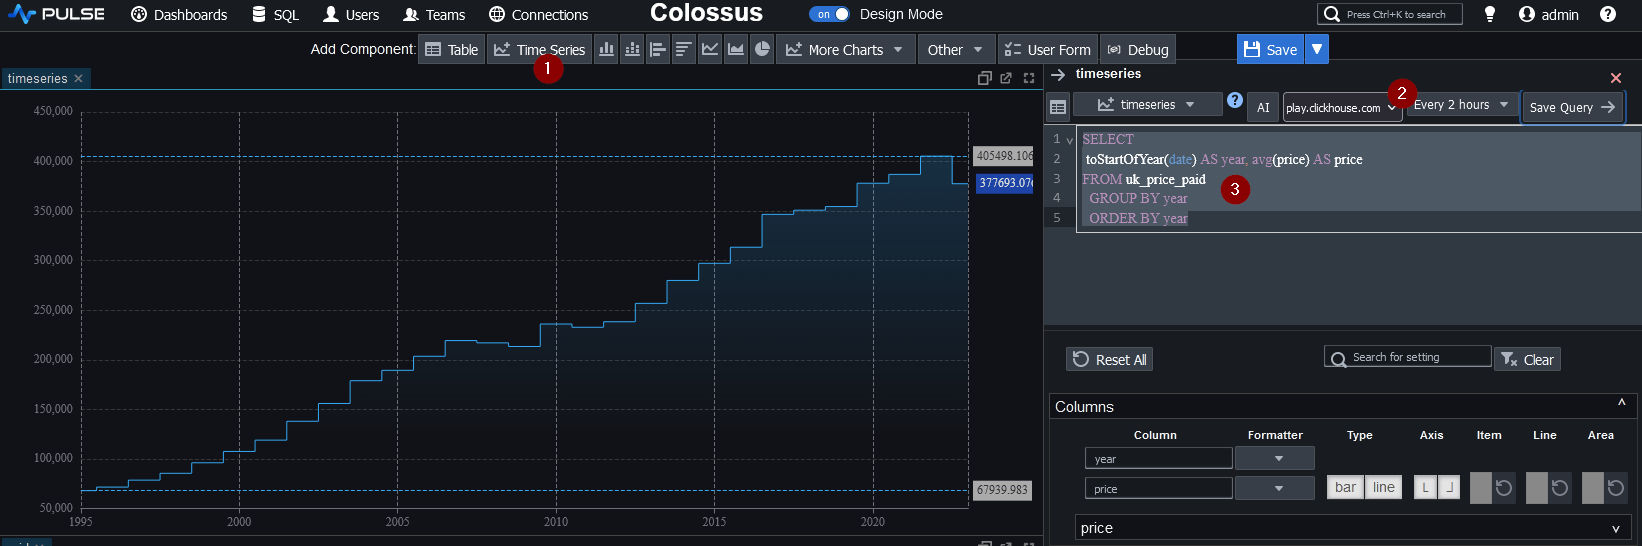
Adding a Chart
The next SQL chart we want is a time-series. We want to display the average price of all properties by year:
User Interaction with Forms
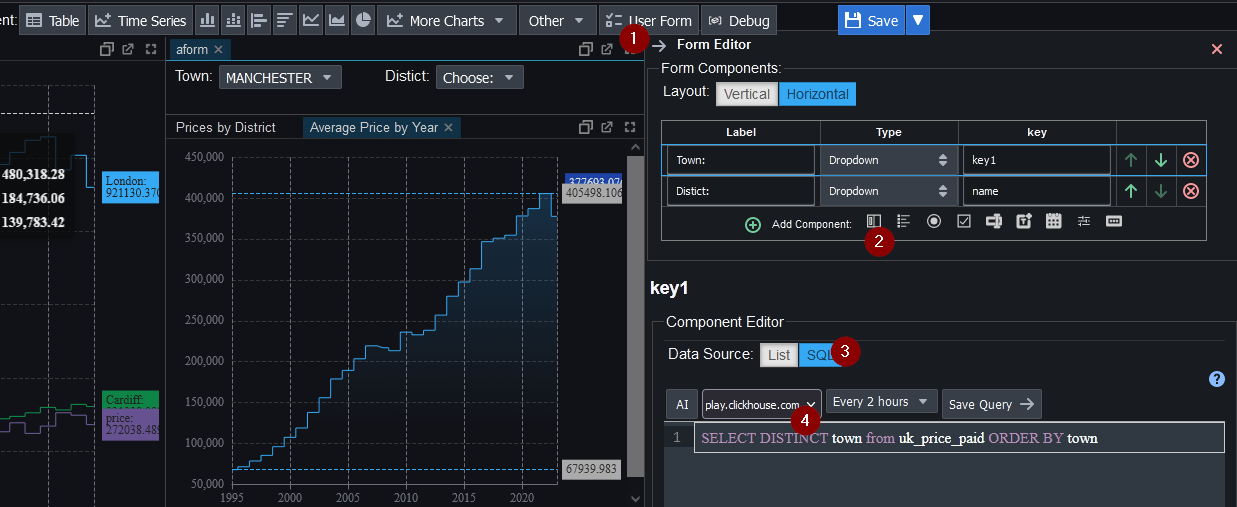
Forms allow user interaction by placing user input within the SQL queries. To create one:
- Click "User Form" on the component bar to add that component.
- Within the Editor, click "Add Component" to add a dropdown component.
- Within the Component Editor, select SQL as the data source
- Specify the query:
SELECT DISTINCT town from uk_price_paid ORDER BY town. Set the query frequency to every 2 hours. - Click the dropdown button to test it.
- The district button is similar but will use the query
SELECT DISTINCT district from uk_price_paid
 WHERE town={{key1}}
 ORDER BY district
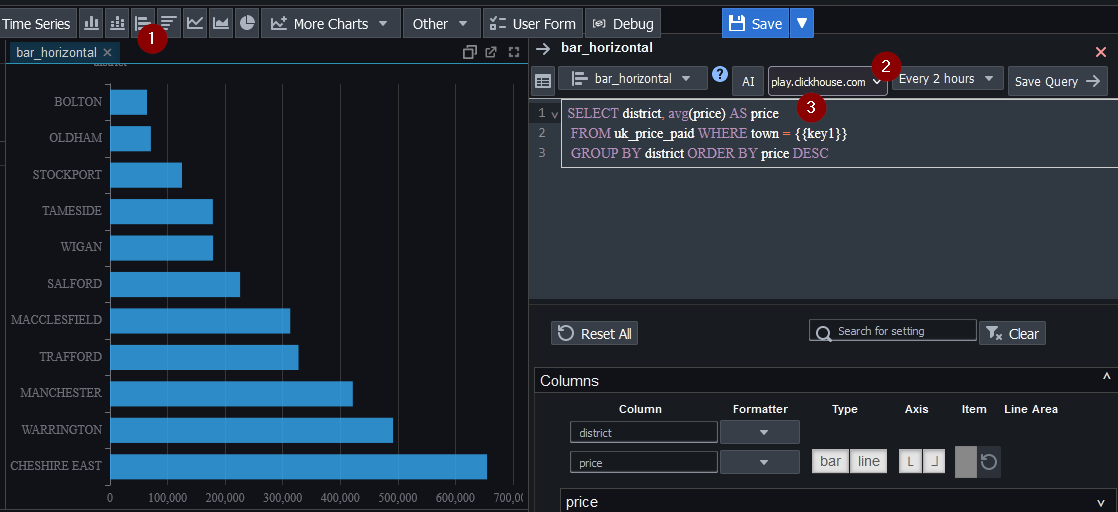
Using Form Values in Charts
To use form values in charts, we use the key name surrounded by parentheses e.g. ((key1)).
Add a bar chart with the SQL:
SELECT district, avg(price) AS price
 FROM uk_price_paid WHERE town = {{key1}}
 GROUP BY district ORDER BY price DESC
More Charts:
Pulse is an extremely flexible platform for creating interactive data applications, the only limit is your imagination and your SQL querying ability. Below are the queries for some further charts we created. You can view these and more on pulseui.net.
Well done, we've created our Clickhouse Dashboard.
I found Clickhouse great to work with. It scores very high on time series benchmarks so is highly suited to real-time dashboards.
Thanks for watching our demo. Please download Pulse to give it a try for yourself.