
Live Timescale Crypto Charts
In this tutorial we will use Timescale Cloud to create a live chart of crypto market data.
Timescale is a time-series SQL database providing fast analytics and scalability based on PostgreSQL.
Contents
Creating new Timescale Database
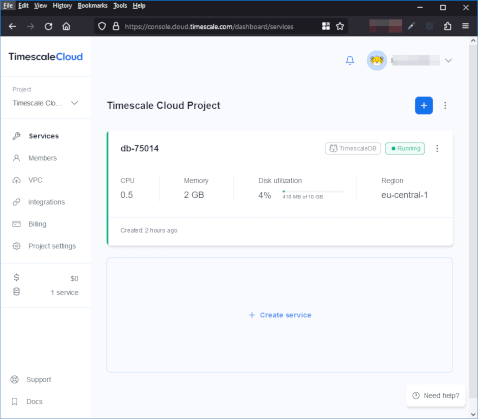
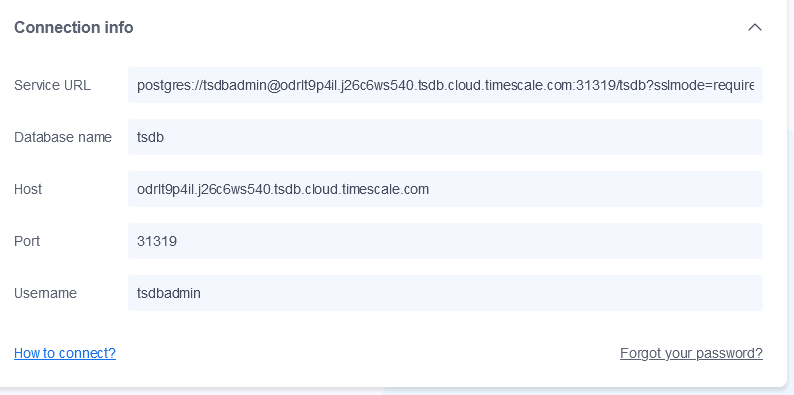
Timescale can either be ran locally or you can use Timescale Cloud. To keep this tutorial simple we opted for cloud. Simply start a small service in your chosen region. The connection details should be provided, similar to shown:
Populating the Tables
To populate our tables, we have created a java program that uses org.knowm.xchange to connect to a number of exchanges and forward data to Timescale using the standard Postgres JDBC driver. To run it yourself, download the jar below or see the source in our github repo.
To create the tables and run the feed, run it with the parameters:
You should see output similar to below. The periods "." are the feed waiting. The larger letters T/o are it sending Trades and Orders respectively:
Add Timescale PostgreSQL Connection
Download Pulse. Any platform is fine, then launch pulse.exe or pulse-log.sh. This will open the pulse UI in a web browser.
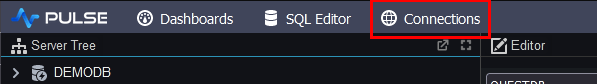
Click Connections to go to the connections screen.
Timescale is PostgreSQL (not forked/reimplemented), therefore the standard postgres driver can be used.
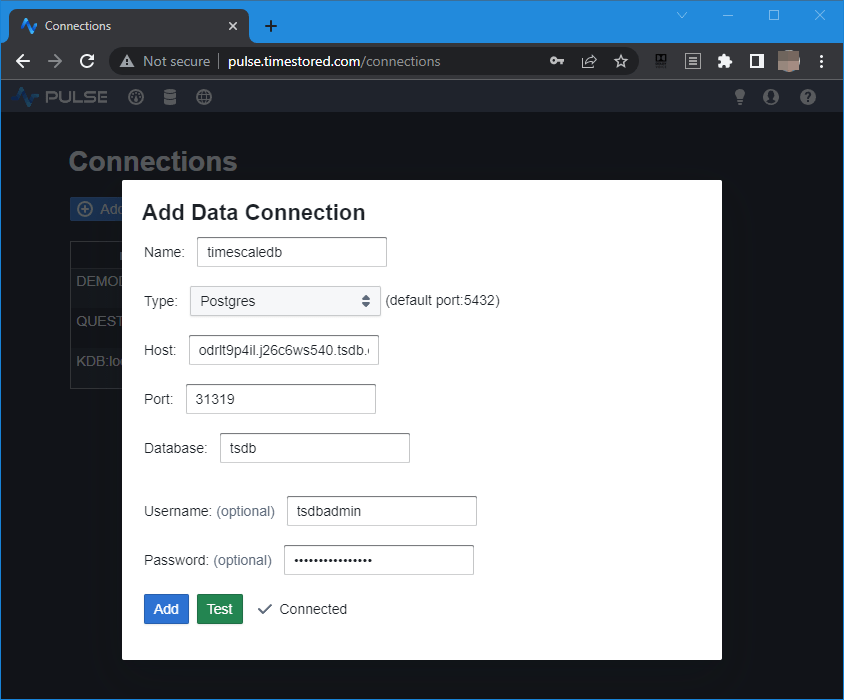
To add a connection in Pulse goto Connections->"Add Data Connection" and fill in your details.
You can try clicking test to see if the connection works before adding it.
- type: Postgres
- host: odrlt9p4il.j26c6ws540.tsdb.cloud.timescale.com
- port: 31319
- database: tsdb
- username: tsdbadmin
- password: wfs87wik6faoyrs9
Note: A very small number of users have received "org.postgresql.util.PSQLException: SSL error: Received fatal alert: handshake_failure" errors when attempting to add a timescale connection. This is due to the SSL certificates available in the java VM they are attempting to use. If this happens, try a different java version or contact us for help
Adding our First Table
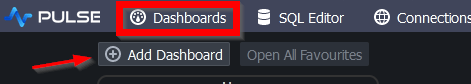
- On the applications listing page, click add
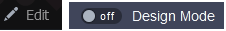
- Click on the newly created application to go into it. Either click on edit or toggle design mode once in the application.
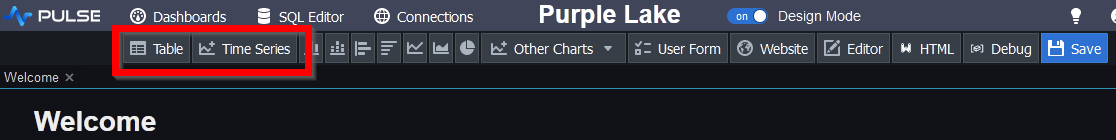
- On the component bar, click "Table" to add a grid.
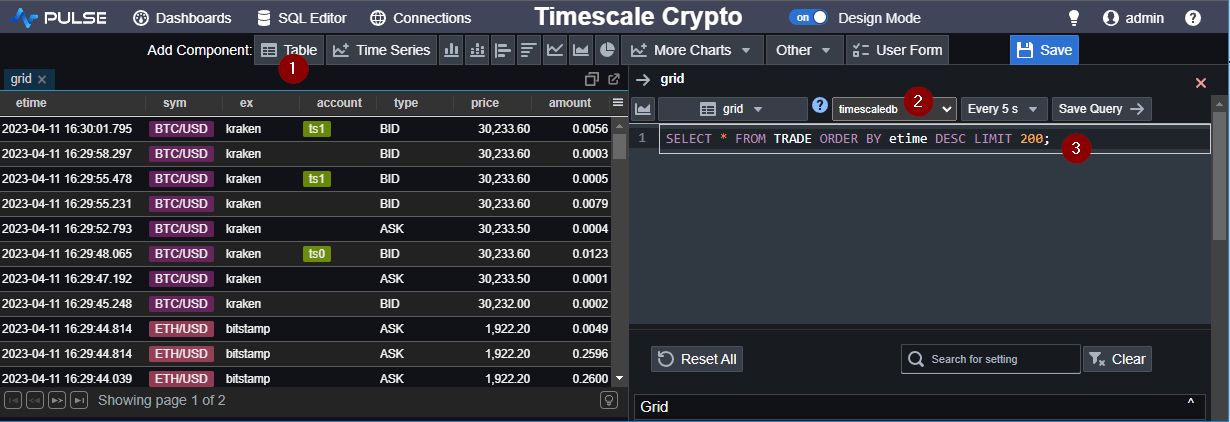
- Within the Editor
- Select the Timescale server
- Enter the query:
SELECT * FROM TRADE ORDER BY etime DESC LIMIT 200;
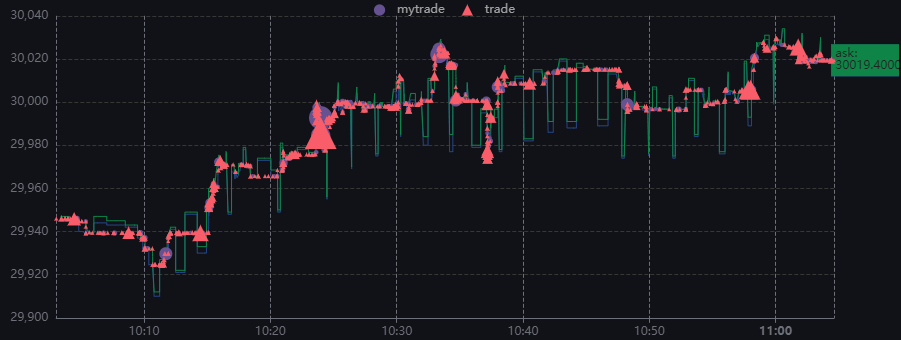
Adding a Chart
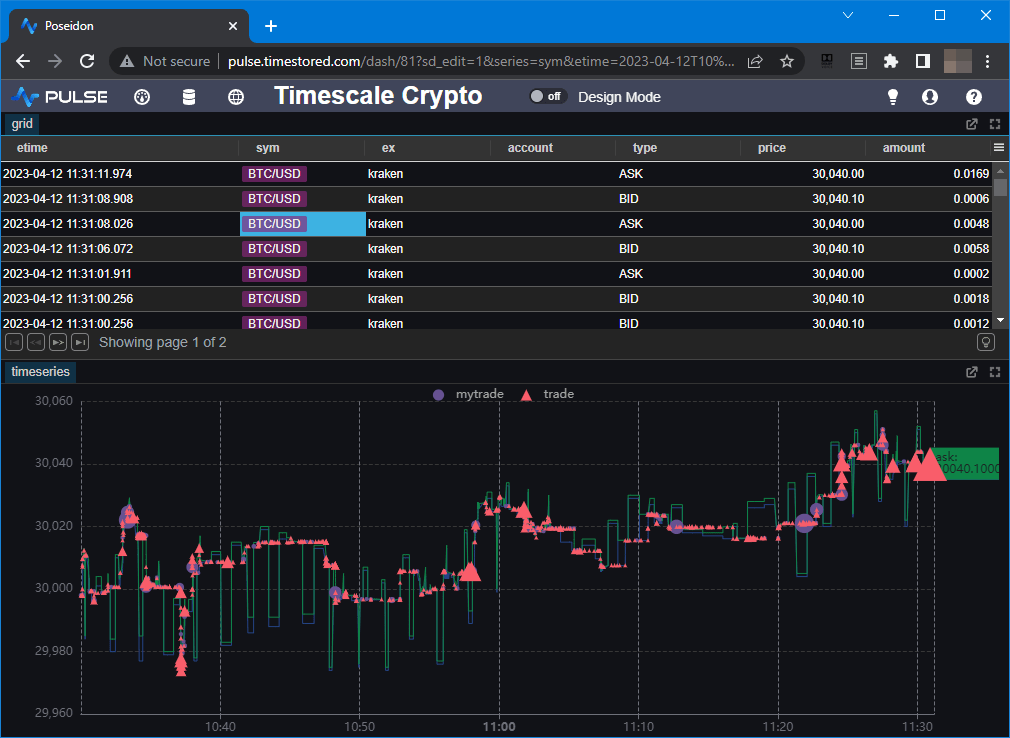
The next SQL chart we want is a time-series. We use UNION to join the quotes + my trades + others trades. So that the bid/ask quotes are shown as lines, while the trades have triangle/circle shapes relative to the size of the trade:
Linking Tables and Charts
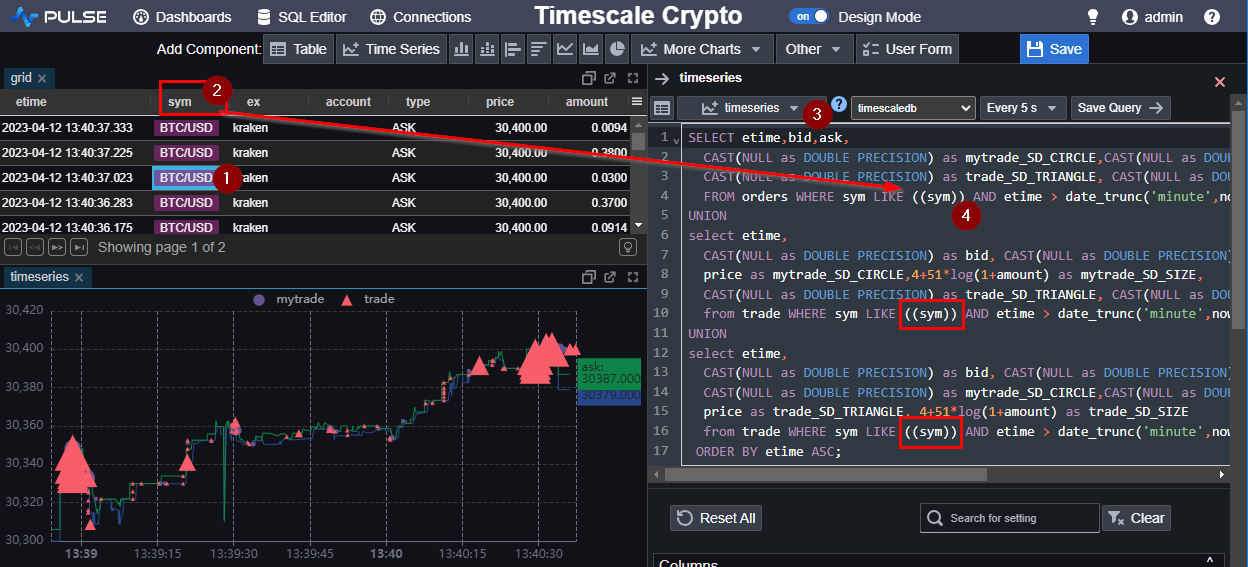
Table Click Events allow users to click a row in a table, and have a chart show related data:
- When a user clicks a row, the first few column names become populated with the value in that row.
- i.e.
((sym))->"BTC/USD"The sym variable maps to the value "BTC/USD". - In the timeseries chart configuration
- We can then use
((sym))in the SQL query and the chart will be updated when the user clicks a row.
Well Done
Well done, we've created our Timescale Crypto Application.
I found Timescale good to work with. Since it's mostly PostgreSQL based I was able to reuse a lot of my existing knowledge.
We added it to our top list of time-series databases.
To me the exciting features of Timescale are:
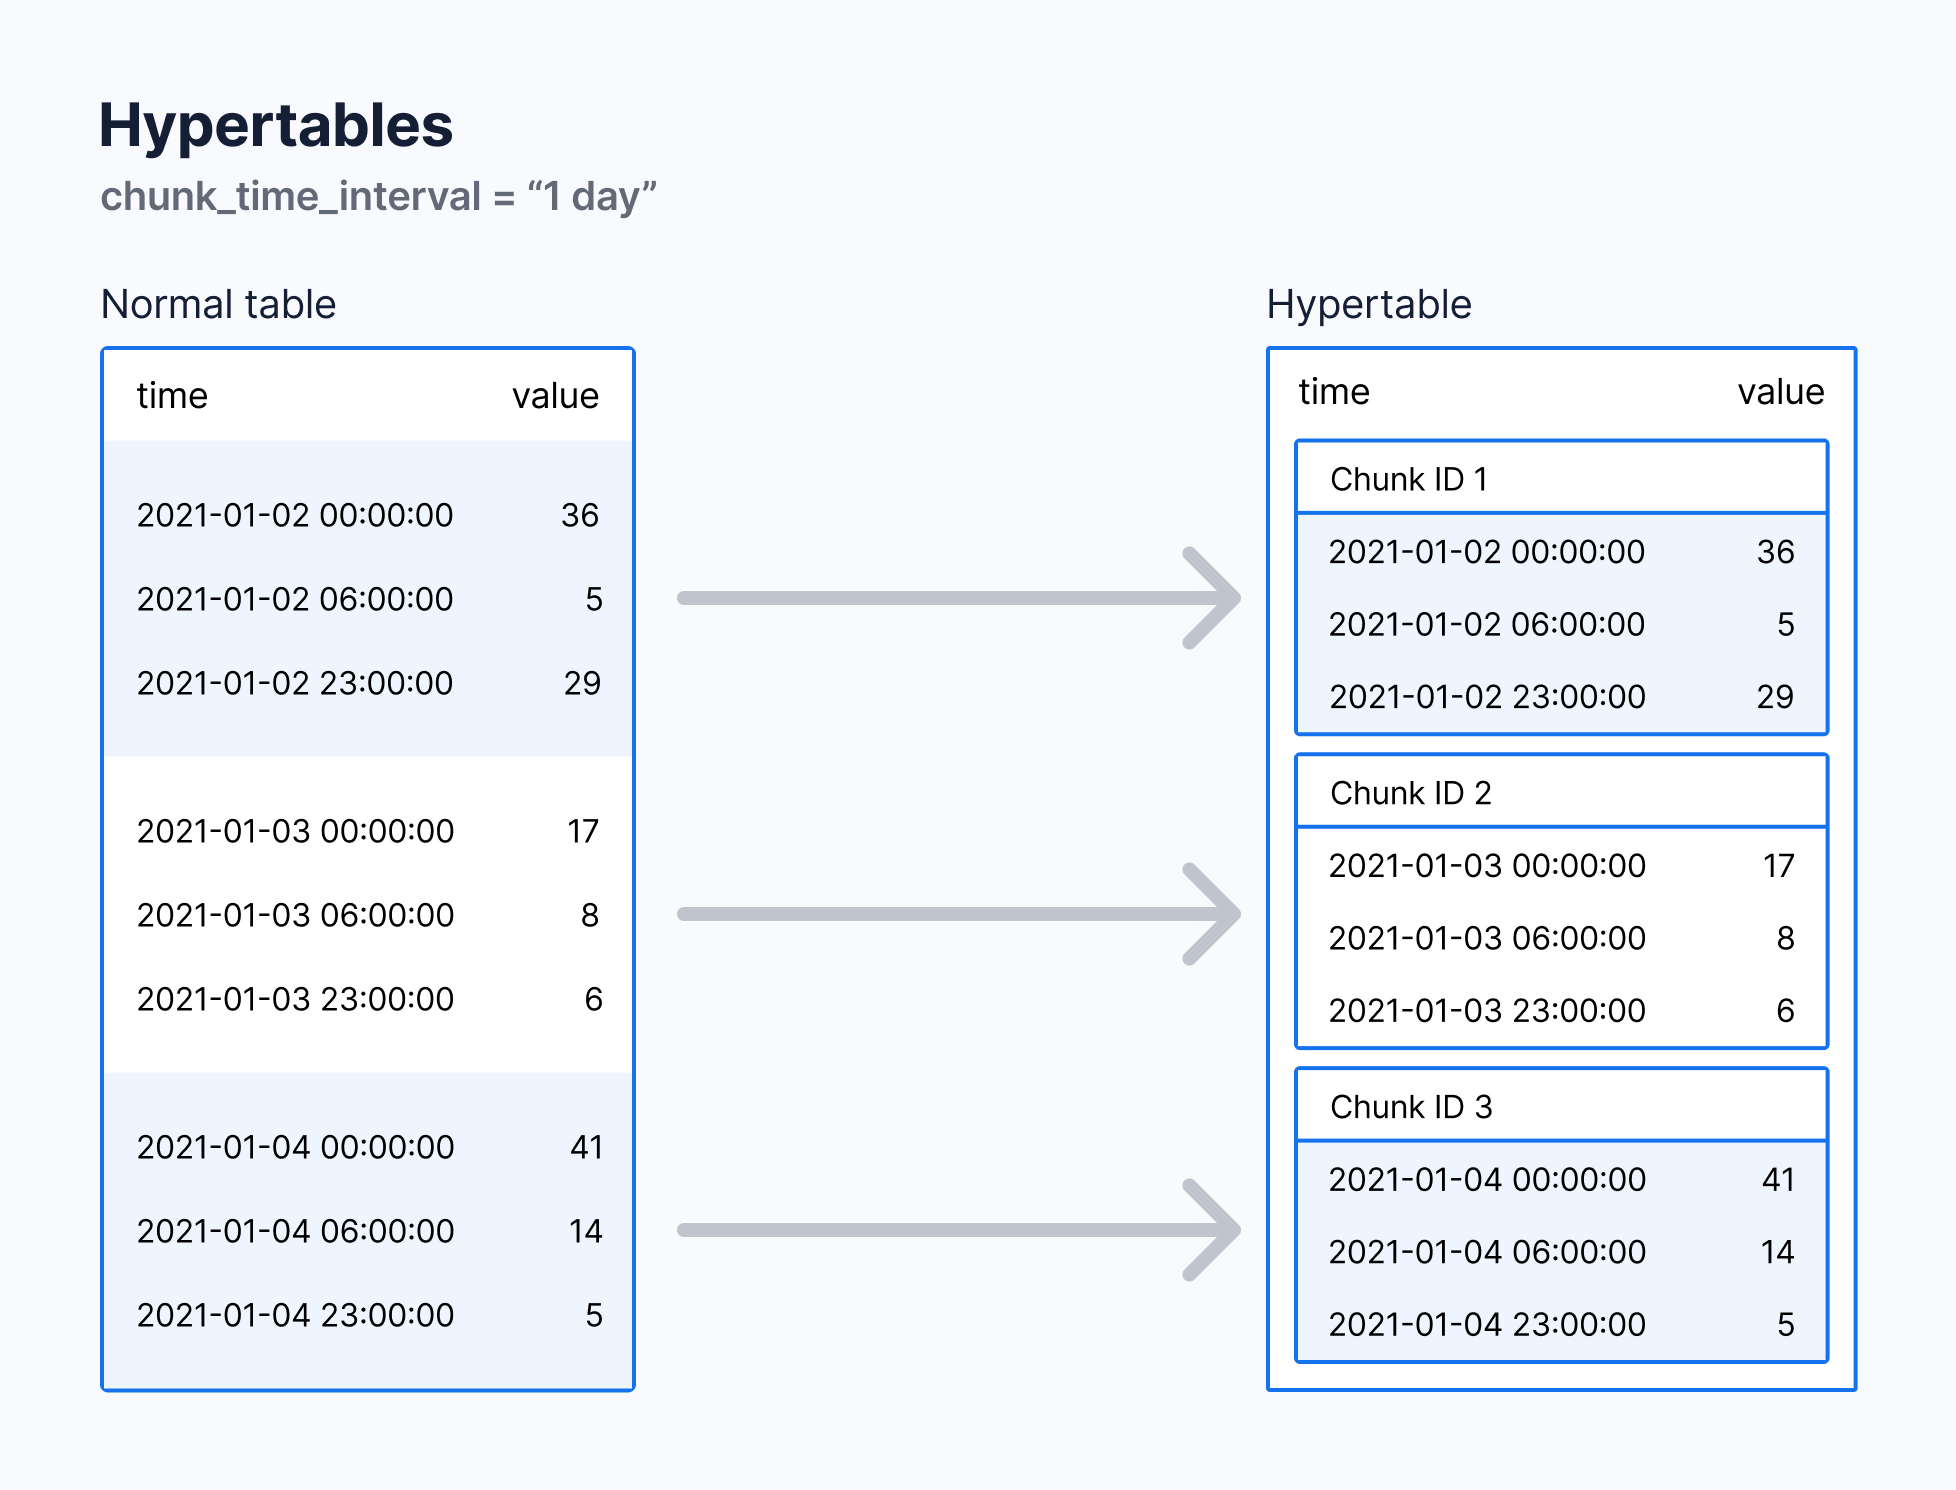
- Hypertables - automatically partitions data by time, and optionally by space. Each hypertable is made up of child tables called chunks. Each chunk is assigned a range of time, and only contains data from that range. If the hypertable is also partitioned by space, each chunk is also assigned a subset of the space values.
- Continuous Aggregates - First, Timescale processes the aggregation calculations when the aggregate is created and then stores the aggregation results to minimize re-calculation when new raw data is added.
Thanks for watching our demo. Please download Pulse to give it a try for yourself.