Table Click Events
Interactive Table Click
Clicking on a table:
- Can run user specified Event Handlers
- Populates Variables that can be used
Chart Click Event Handlers
Event Handlers allow specifying SQL to run and URLS to open when a chart is clicked. It can also be used to add right-click context menu options. Event handlers for tables receive a event variables e.* with full details for the clicked row. For more information see the Event Handlers page.
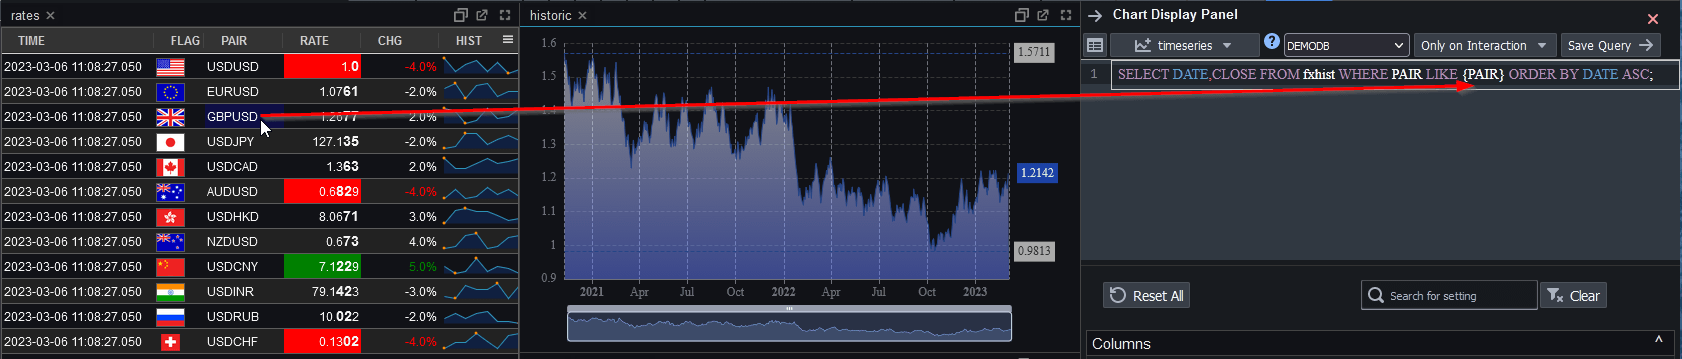
Example Table Click Variables
Clicking a row in the table, creates a variable named PAIR.
We can then use {PAIR} within the time-series graph query to draw the graph for that selected item
For the full example and code, see our interactive table tutorial:
Creating an Interactive Application
Interactive Table Click
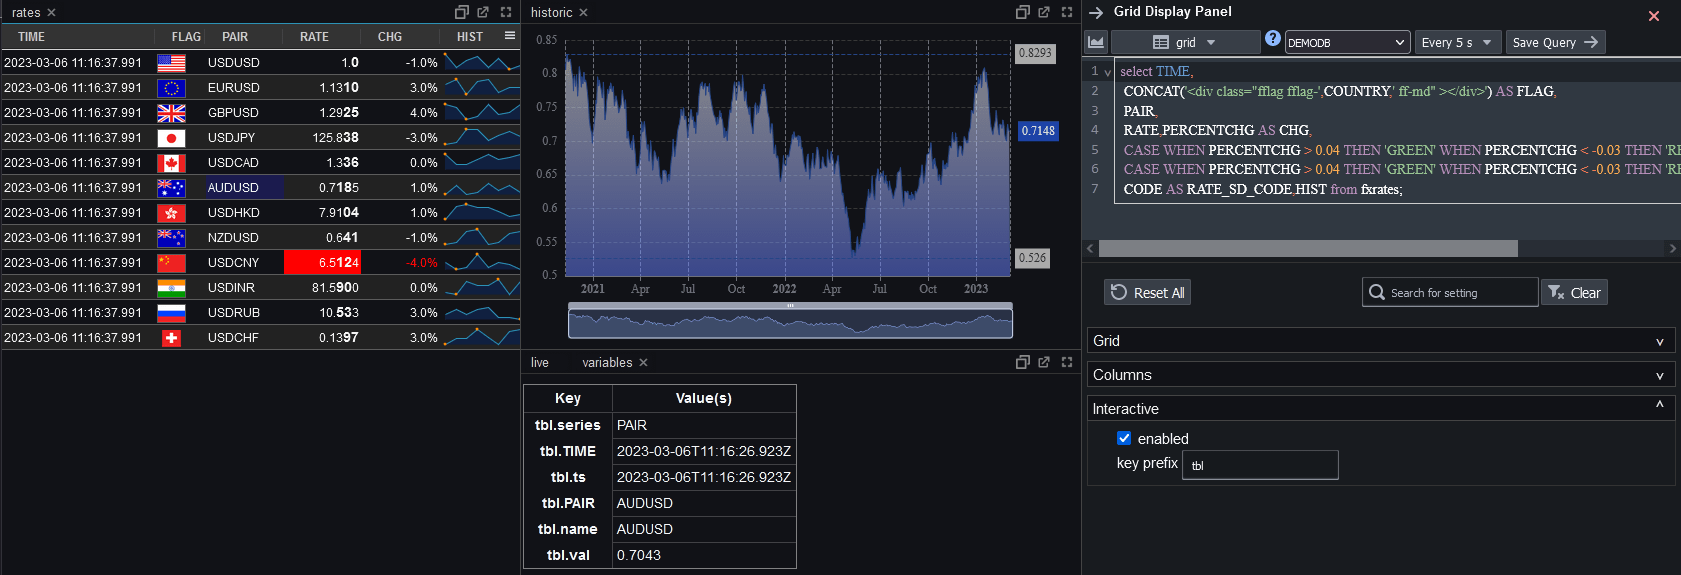
When a user clicks a table or chart, the below specially named values will be set where possible.
This similar naming to chart click events, allows easy interaction between the two.
| Variable | Description |
|---|---|
| .ts | TimeStamp. The value of the first date/timestamp column in the row. |
| .name | The value of the first short non-HTML string column in the row. |
| .series | The column name for where the user clicked. |
| .val | The value of the first numeric column in the row. |
Additionally the first 3 columns will generate 3 variables mapping columnName->Corresponding Column Value.
NOT all column values are set as this would pollute the global context with a large number of long variables. It would also generate very long addresses in the address bar. If you want to use more values from that data row, you should use one of the first 3 columns as an ID column, that allows you to retrieve any further columns later.
Note, the editor panel contains a "key prefix" setting, this allows the author to add a prefix to the variable names to allow avoiding collisions between charts.