Finding Pi using Monte Carlo Simulations in kdb q
In a previous post I looked at using the monte carlo method in kdb to find the outcome of rolling two dice. I also posed the question:
How can we find the value of Pi using the Monte Carlo method?
If we randomly chose an (x,y) location, we could calculate the distance of that points location ( sqrt[x²+y²] ) from the origin, this would tell us if that point lay within a circle or outside a circle, by whether the length was greater than our radius. The ratio of the points that fall within the circle relative to the square that bounds our circle, gives us the ratio of the areas.
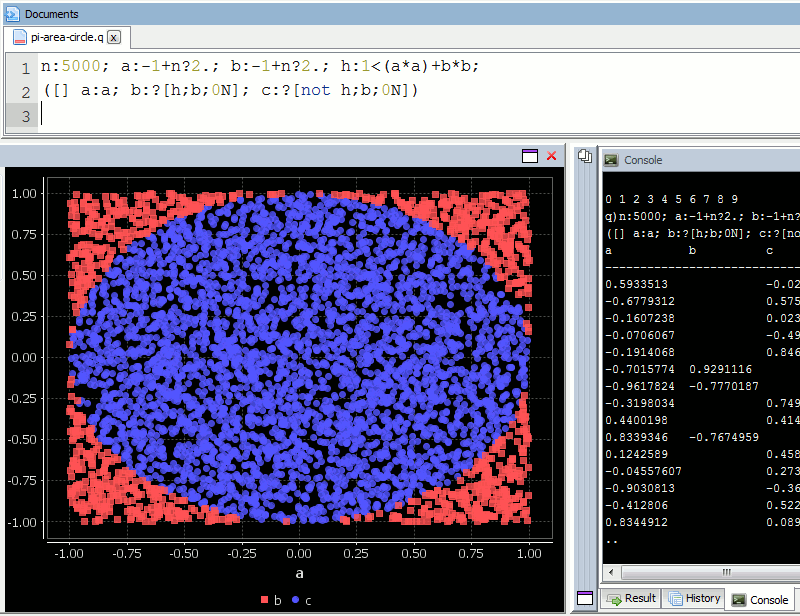
A diagram is probably the easiest way to visualize this problem. If we generate two lists of random numbers between -1 to 1. And use those as the coordinates (x,y), then create a scatter plot that plots (x,y) in one colour where x²+y² is greater than 1 and a different colour where it is less than 1, we would find a pattern emerging…in qStudio it looks like this:
We know the area of our bounding square is 2*2 and that areaOfCircle=Pi*r*r, where r is 1. Therefore we can see that:
areaOfCircle = shadedRatio*areaOfSquare

Pi = shadedRatio * 4
q)4*sum[not h]%count h
3.141208
The wikipedia article on monte carlo method steps through this same example, as you can see their diagram looks similar: