qStudio adds Step Plots for displaying price Steps.
April 2nd, 2018 by admin
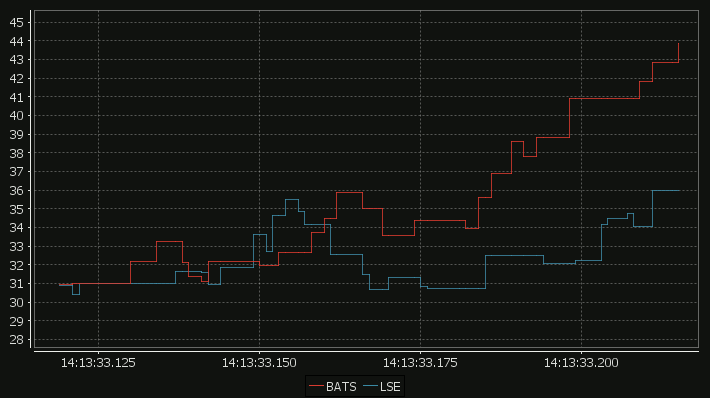
Our standard time-series graph interpolates between points. When the data you are displaying is price points, it’s not really valid to always interpolate. If the price was 0.40 at 2pm then 0.46 at 3pm, that does not mean it could be interpreted as 0.43 at 2.30pm. Amazingly till now, sqlDashboards had no sensible way to show taht data. Now we do:
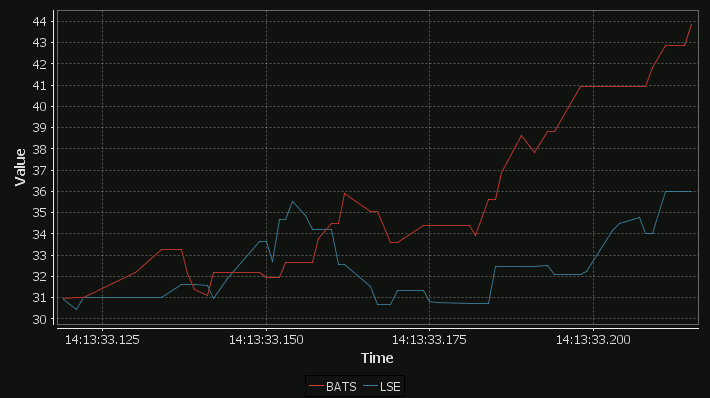
For comparison here is the same data as a time-series graph:
The step-plot is usable for time-series and numerical XY data series. The format is detailed on the usual chart format pages.
[…] qStudio adds Step Plots for displaying price Steps. […]