qStudio now supports Stacked Bar Charts
April 2nd, 2018 by admin
qStudio has added support for stacked bar charts:
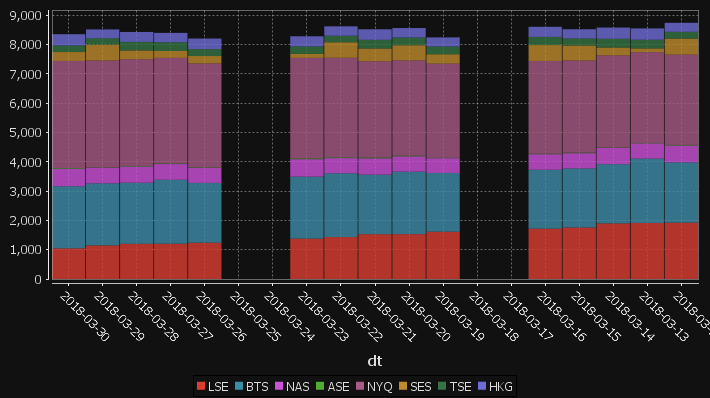
The chart format for this is: The first string columns are used as category labels. Whatever numeric columns appear next are a separate series in the chart. Each row in the data becomes one stacked bar. The table for the data shown above for example is:
| dt | LSE | BTS | NAS | ASE | NYQ | SES | TSE | HKG |
|---|---|---|---|---|---|---|---|---|
| 2018-03-30 | 1047 | 2120 | 592 | 25 | 3660 | 303 | 225 | 383 |
| 2018-03-29 | 1148 | 2118 | 528 | 10 | 3656 | 541 | 215 | 303 |
| 2018-03-28 | 1201 | 2085 | 555 | 17 | 3644 | 302 | 290 | 339 |
| 2018-03-27 | 1206 | 2182 | 535 | 21 | 3604 | 235 | 299 | 319 |
| 2018-03-26 | 1239 | 2041 | 515 | 16 | 3549 | 251 | 234 | 363 |
| 2018-03-25 | 0 | 0 | 0 | 0 | 0 | 0 | 0 | 0 |
| 2018-03-24 | 0 | 0 | 0 | 0 | 0 | 0 | 0 | 0 |
| 2018-03-23 | 1379 | 2115 | 595 | 29 | 3430 | 138 | 251 | 348 |
| 2018-03-22 | 1431 | 2179 | 517 | 25 | 3399 | 531 | 222 | 320 |
| 2018-03-21 | 1530 | 2032 | 558 | 29 | 3282 | 438 | 296 | 359 |
| 2018-03-20 | 1531 | 2134 | 520 | 23 | 3256 | 515 | 265 | 322 |
You may need to “kdb pivot” your original data to get it in the correct shape.