Exponential Moving Average EMA in Kdb
Let’s look at how to write moving average analytics in q for the kdb database. As example data (mcd.csv) we are going to use stock price data for McDonalds MCD. The below code will download historical stock data for MCD and place it into table t:
Simple Moving Average
The simple moving average can be used to smooth out fluctuating data to identify overall trends and cycles. The simple moving average is the mean of the data points and weights every value in the calculation equally. For example to find the moving average price of a stock for the past ten days, we simply add the daily price for those ten days and divide by ten. This window of size ten days then moves across the dates, using the values within the window to find the average. Here’s the code in kdb for 10/20 day moving average and the resultant chart.
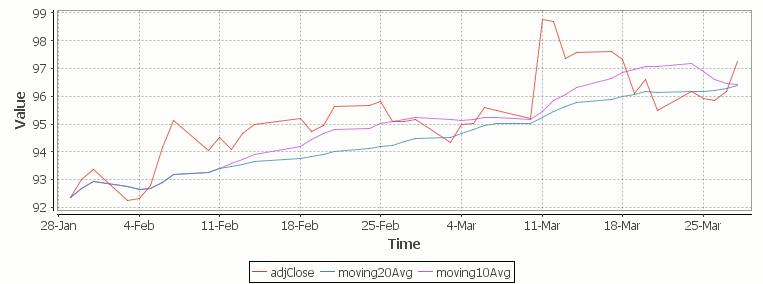
Simple Moving Average Stock Chart Kdb (Produced using qStudio)
What Exponential Moving Average is and how to calculate it
One of the issues with the simple moving average is that it gives every day an equal weighting. For many purposes it makes more sense to give the more recent days a higher weighting, one method of doing this is by using the Exponential Moving Average. This uses an exponentially decreasing weight for dates further in the past.The simplest form of exponential smoothing is given by the formula:
![]()
where α is the smoothing factor, and 0 < α < 1. In other words, the smoothed statistic st is a simple weighted average of the previous observation xt-1 and the previous smoothed statistic st−1.
This table displays how the various weights/EMAs are calculated given the values 1,2,3,4,8,10,20 and a smoothing factor of 0.7: (excel spreadsheet)
| Values | EMA | Power | Weight | Power*Weight | EMA (text using previous value) | ||
|---|---|---|---|---|---|---|---|
| 1 | 1 | 6 | 0.0005103 | 0.0005103 | 1 | ||
| 2 | 1.7 | 5 | 0.001701 | 0.003402 | (0.7*2)+(0.3*1) | ||
| 3 | 2.61 | 4 | 0.00567 | 0.01701 | (0.7*3)+(0.3*1.7) | ||
| 4 | 3.583 | 3 | 0.0189 | 0.0756 | (0.7*4)+(0.3*2.61) | ||
| 8 | 6.6749 | 2 | 0.063 | 0.504 | (0.7*8)+(0.3*3.583) | ||
| 10 | 9.00247 | 1 | 0.21 | 2.1 | (0.7*10)+(0.3*6.6749) | ||
| 20 | 16.700741 | 0 | 0.7 | 14 | (0.7*20)+(0.3*9.00247) |
To perform this calculation in kdb we can do the following:
(This code was originally posted to the google mail list by Attila, the full discussion can be found here)
This backslash adverb works as
The alternate syntax generalizes to functions of 3 or more arguments where the first argument is used as the initial value and the arguments are corresponding elements from the lists:
Exponential Moving Average Chart
Finally we take our formula and apply it to our stock pricing data, allowing us to see the exponential moving average for two different smoothing factors:
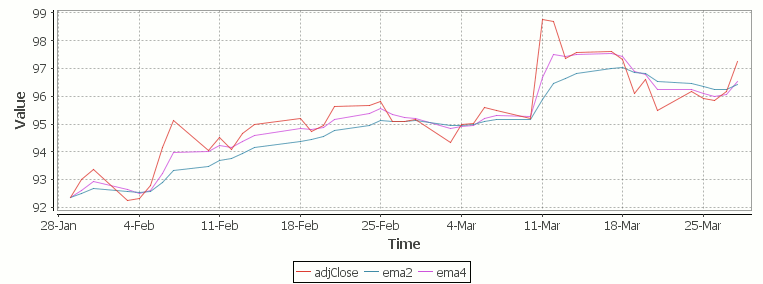
Exponential Moving Average Stock Price Chart produced using qStudio
As you can see with EMA we can prioritize more recent values using a chosen smoothing factor to decide the balance between recent and historical data.
Writing kdb analytics such as Exponential Moving Average is covered in our kdb training course, we regularly provide training courses in London, New York, Asia or our online kdb course is available to start right now.
Thanks Ryan, this is very helpful. But I think there is a typo in ema’s definition, should be:
ema:{first[y]{1-x}\x*y}