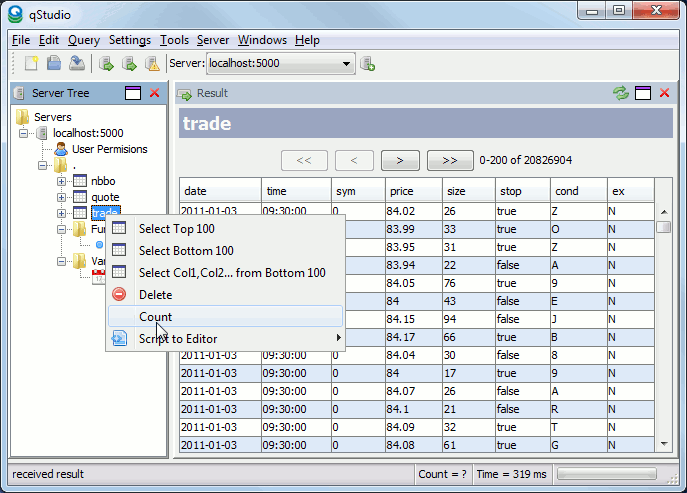
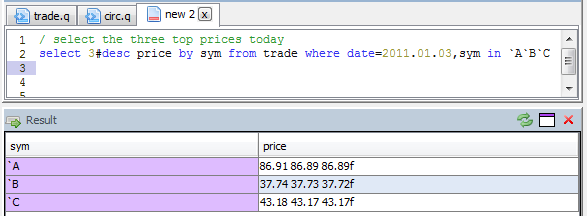
The instructions below will guide you through installing kdb and specialised tools to speed your development.

Contents

Installing Kdb

  1. Download Trial Kdb version, this is limited in time and memory but is useful for learning q.
  2. Usually you must place the q folder at c:\q in windows or ~/q in Linux, otherwise you must set the QHOME environment variable to that path (windows instructions)

Linux Configuration

Typically in Linux I install to /opt/q install rlwrap and place the following in my .bashrc script

Windows Tools

Windows Command Window

You can run kdb by going "start menu" -> run -> cmd -> [Enter] Then:

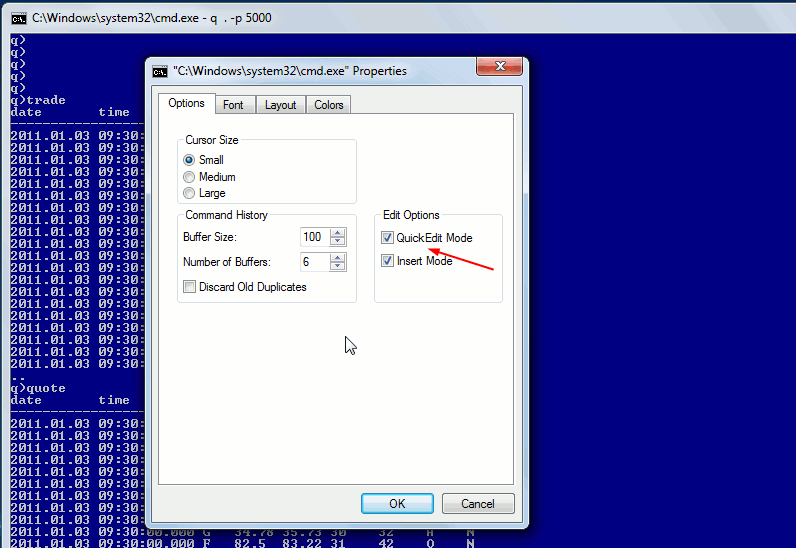
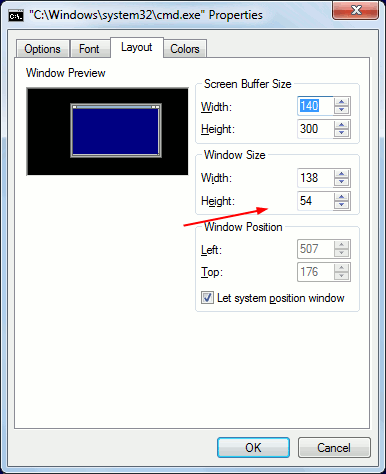
By default windows command window is only 80 characters wide and does not support one click pasting. To change that, left click on the icon in the top left of the window and goto properties, you should then see the screens shown below. You should enable quickedit mode to allow right-click -> pasting and configure the height/width as you please. Text can be copied by highlighting with the mouse and pressing enter. Some people prefer replacing the standard window completely with powercmd.

configuring CMD window for Kdb configuring CMD window for Kdb

Notepad++

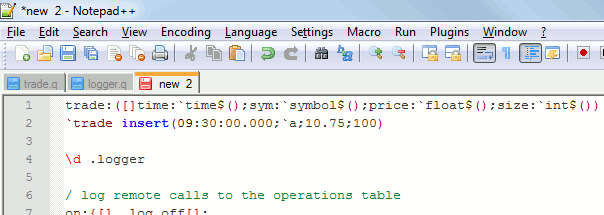
Notepad++ is a source code edit or for windows, we can get it to syntax highlight q code as follows:.

  1. Download qlang.xml
  2. In Notepad++
    • (Before version 6.6) goto menu -> View -> User Defined Dialogue ->Import and select qlang.xml
    • (Version 6.6+) goto menu -> Language -> Define Your Language... -> Import...
  3. Restart notepad++ then close and reopen any .q/.k files, they should now be highlighted as shown below.

Intellij kdb/q highlighting is also available.

Advanced Debugging

When you run into problems, kdb taking significantly longer than usual to load, requiring much more memory than usual or locking up, These programs are extremely useful for finding the root cause:

Linux Tools

  • VIM syntax highlight is available for the q language see Readme for details on installing.
  • If you want to be able to use the up/down arrow to repeat previous commands you will want rlwrap.
  • Advanced Debugging Tools
    • Strace - is extremely useful for monitoring system calls like opening / reading of files and ports
    • GDB - is a debugger more useful for analysing crashes.

kdb+ IDEs

There are a number of IDEs for kdb to choose from:

  1. qStudio - highlighting, autocomplete, query server this would be our choice though we are ofcourse bias. kdb+ GUI with built-in Charting
  2. Studio for Kdb - The original IDE by Charles Skelton
  3. Q and K Development Tools - An eclipse like interface