
Integration with the tools you use


Pulse is a Developer platform for internal data UIs.
It enables data analysts and quants to quickly build interactive data tools fast,
while being scalable, secure and meeting finance firms non-functional requirements.
You write the core pieces important to your business and we handle the rest.
Authentication, Authorization, Auditing, Notifications, Permissions, failover, recovery... all the boring parts.
Quick App Creation
Accelerate your time from concept to action.. Create useful interactive dashboards within minutes:
- Trade Blotters
- Trade and Quote Charts
- Algo Configuration Controls
- PnL Charts
- TCA Analysis
- Live Price Grids
Powerful Real-time Components with Incredible Performance
Handles thousands of updates per second. Out of the box grid and time-series plotting that scales.
Specialized for Finance
Allows plotting bid/ask as lines with either internal/external trades as shapes with their size showing the volume of that trade
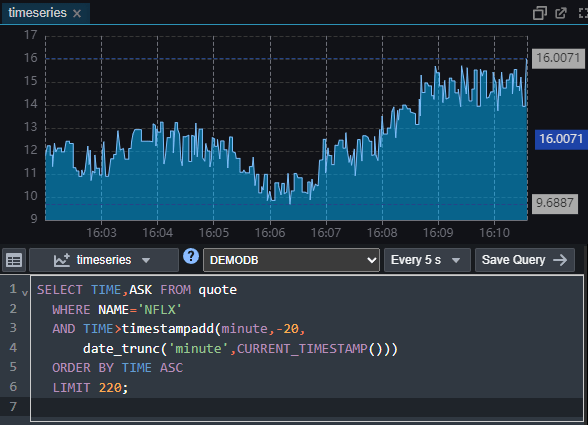
Display or Write data with queries
Simply write the SQL query and Pulse will intelligently render your selected visualization. With 100s of configuration options available from the UI when you need them:
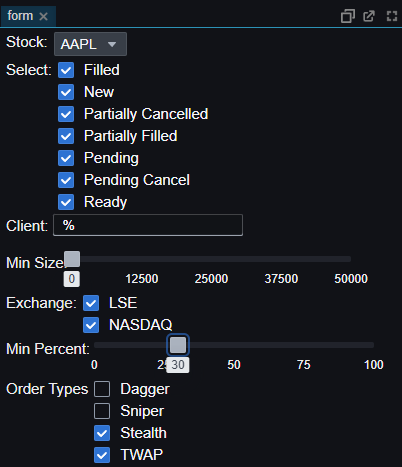
Program User Interactions Easily
Pulse allows creating complete forms with all types of inputs. Then using the user selected inputs within your SQL queries.
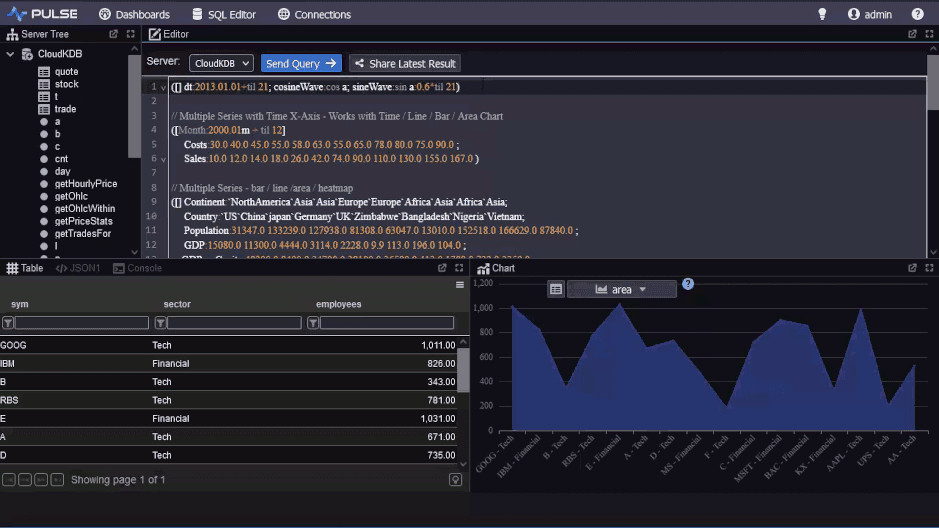
SQL Editor
A web version of our much loved QStudio that allows charting data, browsing tables and
sharing queries or charts as easily as sending a link.
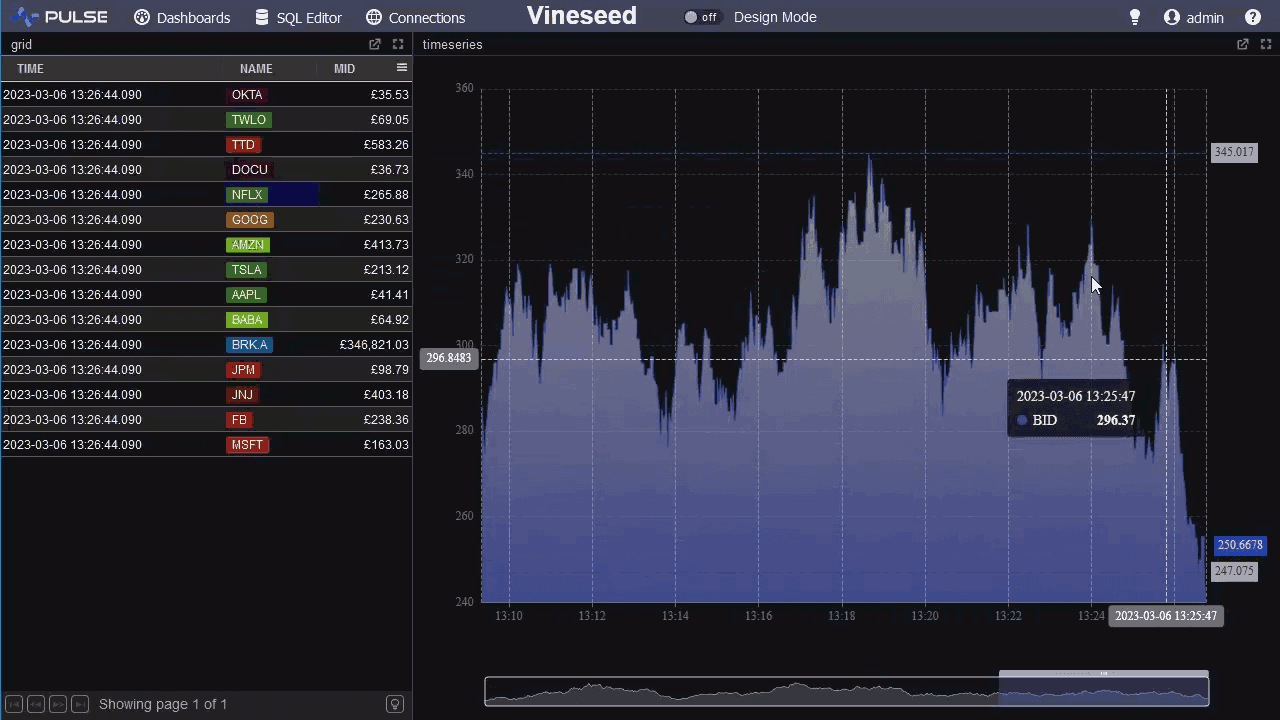
Link Tables and Charts
Table interactions can be programmed and used to update charts or display menus. For example when a user clicks the row in the table, the time-series graph for that row is displayed.
Why Pulse?
Half the software in the world is internal tooling. For every line of code behind your favourite app there's more code powering internal platforms and operations.
These tools are:
- Massively important to success of business
- Chronically under-invested in, as nobody wants to work on these tools