Archive for the 'timeseries' Category
January 19th, 2015 by Ryan Hamilton
In a world overran with open source big data solutions is kdb+ going to be left behind? I hope not…
Every few weeks someone comes to me with a big data problem often with a half-done mongoDB/NoSQL solution that they “want a little help with”. Usually after looking at it I think to myself
“I could solve this in 20 minutes with 5 lines of q code”
But how do I tell someone they should use a system which may end up costing them £1,000s per core in licensing costs. Yes it’s great that there’s a free 32-bit trial version but the risk that you may end up needing the 64-bit is too great a risk.
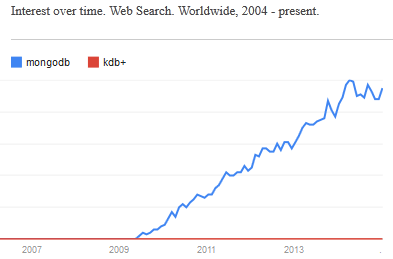
Given the ever-increasing number of NoSQL solutions and in particular the rising popularity of Hadoop, R, python and MongoDB it’s not hard to see that open-source is taking over the world. Right now kdb+ still has the edge, that it’s faster, sleeker, sexier..but I don’t think that will save it in the long run. The power of open-source is that it let’s everyone contribute, witness the 100’s of libraries available for R, the 1000’s of javascript frameworks. The truly sad thing is that it’s not always the best underlying technology that wins. A 1000 amateurs creating a vibrant ecosystem of plug-ins, add-ons, tutorials… can beat other technologies through sheer force of numbers.
- APL was a great language yet it remains relegated to history while PHP flourishes.
- PostgreSQL was technically superior to MySQL yet MySQL is deployed everywhere
I believe kdb+ is the best solution to a large number of “big data” problems (small data to kdb+), When you stop and think, time-series data is everywhere, open sourcing kdb+ would open up entirely new sectors to kdb+ and I hope it’s a step kx take before it’s too late.
What do you think? Leave your comments below.
September 8th, 2014 by admin
I always like to investigate new technology and this week I found a nice automatic technique for improved cache use that I had previously seen some people manually write.
Consider a database query with three steps (three SQL SELECTs), some databases may pass results of each step to temporary tables in main memory. When the first step is finished, these intermediate results are passed back into CPU cache to be transformed by the second step, then back into a new temporary table in main memory, and so on.
To eliminate this back-and-forth, vector-based statistical functions can be pipelined, with the output of one function becoming input for the next, whose output feeds a third function, etc. Intermediate results stay in the pipeline inside CPU cache, with only the full result being materialized at the end.
This technology is part of ExtremeDB, they have a video that explains it well:
Moving Averages Stock Price Example
This is what the actual code would look like to calculate the 5-day and 21-day moving averages for a stock and detect the points where the faster moving average (5-day) crosses over or under the slower moving average (21-day):
- Two invocations of ‘seq_window_agg_avg’ execute over the closing price sequence, ‘ClosePrice’, to obtain 5-day and 21-day moving averages.
- The function ‘seq_sub’ subtracts 21- from 5-day moving averages;
- The result “feeds” a fourth function, ‘seq_cross’, to identify where the 5- and 21-day moving averages cross.
- Finally, the function ‘seq_map’ maps the crossovers to the original ‘ClosePrice’ sequence, returning closing prices where the moving averages crossed.
This approach eliminates the need to create, populate and query temporary tables outside CPU cache in main memory. One “tile” of input data is processed by each invocation of ‘mco_seq_window_agg_avg_double()’, each time producing one tile of output that is passed to ‘mco_seq_sub_double()’ which, in turn, produces one tile of output that is passed as input to mco_seq_cross_double(), which produces one tile of output that is passed to mco_seq_map_double(). When the last function, mco_seq_map_double() has exhausted its input, the whole process repeats from the top to produce new tiles for additional processing.
A very cool idea!
And yes, ExtremeDB are the same guys that posted the top Stac M3 benchmark for a while (in 2012/13 I think).
March 30th, 2014 by Ryan Hamilton
Often at the start of one of our training courses I’m asked why banks use the Kdb Database for their tick data.
- One well known reason is that kdb is really fast at typical financial time-series queries
(due to Kdbs column-oriented architecture).
- Another reason is that qSQL is extremely expressive and well suited for time-series queries.
To demonstrate this I’d like to look at three example queries, comparing qSQL to standard SQL.
SQL Queries dependent on order
From the table below we would like to find the price change between consecutive rows.
| time |
price |
| 07:00 |
0.9 |
| 08:30 |
1.5 |
| 09:59 |
1.9 |
| 10:00 |
2 |
| 12:00 |
9 |
|
|
q Code
In kdb qSQL this would be the extremely simple and readable code:
Standard SQL
In standard SQL there are a few methods, we can use. The simplest is if we already have a sequential id column present:
Even for this simple query our code is much longer and not as clear to read. If we hadn’t had the id column we would have needed much more code to create a temporary table with row numbers. As our queries get more complex the situation gets worse.
Select top N by category
Given a table of stock trade prices at various times today, find the top two trade prices for each ticker.
trade table
| time |
sym |
price |
| 09:00 |
a |
80 |
| 09:03 |
b |
10 |
| 09:05 |
c |
30 |
| 09:10 |
a |
85 |
| 09:20 |
a |
75 |
| 09:30 |
b |
13 |
| 09:40 |
b |
14 |
|
|
qSQL Code
In q code this would be select 2 sublist desc price by sym from trade, anyone that has used kdb for a few days could write the query and it almost reads like english. Select the prices in descending order by sym and from those lists take the first 2 items (sublist).
SQL Code
In standard SQL a query that depends on order is much more difficult , witness the numerous online posts with people having problems: stackoverflow top 10 by category, mysql first n rows by group, MS-SQL top N by group. The nicest solution, if your database supports it, is:
The SQL version is much harder to read and will require someone with more experience to be able to write it.
Joining Records on Nearest Time
Lastly we want to consider performing a time based join. A common finance query is to find the prevailing quote for a given set of trades. i.e. Given the following trade table t and quote table q shown below, we want to find the prevailing quote before or at the exact time of each trade.
trades t
| time |
sym |
price |
size |
| 07:00 |
a |
0.9 |
100 |
| 08:30 |
a |
1.5 |
700 |
| 09:59 |
a |
1.9 |
200 |
| 10:00 |
a |
2 |
400 |
| 12:00 |
b |
9 |
500 |
| 16:00 |
a |
10 |
800 |
|
quotes q
| time |
sym |
bid |
| 08:00 |
a |
1 |
| 09:00 |
b |
9 |
| 10:00 |
a |
2 |
| 11:00 |
b |
8 |
| 12:00 |
b |
8.5 |
| 13:00 |
a |
3 |
| 14:00 |
b |
7 |
| 15:00 |
a |
4 |
|
|
In qSQL this is: aj[`sym`time; t; q], which means perform an asof-join on t, looking up the nearest match from table q based on the sym and time column.
In standard SQL, again you’ll have difficulty: sql nearest date, sql closest date even just the closest lesser date isn’t elegant. One solution would be:
It’s worth pointing out this is one of the queries that is typically extremely slow (minutes) on row-oriented databases compared to column-oriented databases (at most a few seconds).
qSQL vs SQL
Looking at the simplicity of the qSQL code compared to the standard SQL code we can see how basing our database on ordered lists rather than set theory is much more suited to time-series data analysis. By being built from the ground up for ordered data and by providing special time-series based joins, kdb let’s us form these example queries using very simple expressions. Once we need to create more complex queries and nested selects, attempting to use standard SQL can quickly spiral into a verbose unmaintainable mess.
I won’t say qSQL can’t be cryptic 🙂 but for time-series queries qSQL will mostly be shorter and simpler than trying to use standard SQL.
If you think you have shorter SQL code that solves one of these examples or you are interested in one of our kdb training courses please get in touch.
March 30th, 2014 by Ryan Hamilton
In this tutorial we are going to recreate this example RSI calculation in q, the language of the kdb database.
The relative strength index (RSI) is a technical indicator used in the analysis of financial markets. It is intended to chart the current and historical strength or weakness of a stock or market based on the closing prices of a recent trading period. The RSI is classified as a momentum oscillator, measuring the velocity and magnitude of directional price movements. Momentum is the rate of the rise or fall in price.
The RSI computes momentum as the ratio of higher closes to lower closes: stocks which have had more or stronger positive changes have a higher RSI than stocks which have had more or stronger negative changes. The RSI is most typically used on a 14 day timeframe, measured on a scale from 0 to 100, with high and low levels marked at 70 and 30, respectively. Shorter or longer timeframes are used for alternately shorter or longer outlooks. More extreme high and low levels—80 and 20, or 90 and 10—occur less frequently but indicate stronger momentum.
.
Stock Price Time-Series Data
We are going to use the following example data, you can download the csv here or the excel version here.
| Date |
QQQQ Close |
Change |
Gain |
Loss |
Avg Gain |
Avg Loss |
RS |
14-day RSI |
| 2009-12-14 |
44.34 |
|
|
|
|
|
|
|
| 2009-12-15 |
44.09 |
-0.25 |
0.00 |
0.25 |
|
|
|
|
| 2009-12-16 |
44.15 |
0.06 |
0.06 |
0.00 |
|
|
|
|
| 2009-12-17 |
43.61 |
-0.54 |
0.00 |
0.54 |
|
|
|
|
| 2009-12-18 |
44.33 |
0.72 |
0.72 |
0.00 |
|
|
|
|
| 2009-12-21 |
44.83 |
0.50 |
0.50 |
0.00 |
|
|
|
|
| 2009-12-22 |
45.10 |
0.27 |
0.27 |
0.00 |
|
|
|
|
| 2009-12-23 |
45.42 |
0.33 |
0.33 |
0.00 |
|
|
|
|
| 2009-12-24 |
45.84 |
0.42 |
0.42 |
0.00 |
|
|
|
|
| 2009-12-28 |
46.08 |
0.24 |
0.24 |
0.00 |
|
|
|
|
| 2009-12-29 |
45.89 |
-0.19 |
0.00 |
0.19 |
|
|
|
|
| 2009-12-30 |
46.03 |
0.14 |
0.14 |
0.00 |
|
|
|
|
| 2009-12-31 |
45.61 |
-0.42 |
0.00 |
0.42 |
|
|
|
|
| 2010-01-04 |
46.28 |
0.67 |
0.67 |
0.00 |
|
|
RS |
RSI |
| 2010-01-05 |
46.28 |
0.00 |
0.00 |
0.00 |
0.24 |
0.10 |
2.39 |
70.53 |
| 2010-01-06 |
46.00 |
-0.28 |
0.00 |
0.28 |
0.22 |
0.11 |
1.97 |
66.32 |
| 2010-01-07 |
46.03 |
0.03 |
0.03 |
0.00 |
0.21 |
0.10 |
1.99 |
66.55 |
| 2010-01-08 |
46.41 |
0.38 |
0.38 |
0.00 |
0.22 |
0.10 |
2.27 |
69.41 |
| 2010-01-11 |
46.22 |
-0.19 |
0.00 |
0.19 |
0.20 |
0.10 |
1.97 |
66.36 |
| 2010-01-12 |
45.64 |
-0.58 |
0.00 |
0.58 |
0.19 |
0.14 |
1.38 |
57.97 |
| 2010-01-13 |
46.21 |
0.57 |
0.57 |
0.00 |
0.22 |
0.13 |
1.70 |
62.93 |
| 2010-01-14 |
46.25 |
0.04 |
0.04 |
0.00 |
0.20 |
0.12 |
1.72 |
63.26 |
| 2010-01-15 |
45.71 |
-0.54 |
0.00 |
0.54 |
0.19 |
0.15 |
1.28 |
56.06 |
| 2010-01-19 |
46.45 |
0.74 |
0.74 |
0.00 |
0.23 |
0.14 |
1.66 |
62.38 |
| 2010-01-20 |
45.78 |
-0.67 |
0.00 |
0.67 |
0.21 |
0.18 |
1.21 |
54.71 |
| 2010-01-21 |
45.35 |
-0.43 |
0.00 |
0.43 |
0.20 |
0.19 |
1.02 |
50.42 |
| 2010-01-22 |
44.03 |
-1.33 |
0.00 |
1.33 |
0.18 |
0.27 |
0.67 |
39.99 |
| 2010-01-25 |
44.18 |
0.15 |
0.15 |
0.00 |
0.18 |
0.26 |
0.71 |
41.46 |
| 2010-01-26 |
44.22 |
0.04 |
0.04 |
0.00 |
0.17 |
0.24 |
0.72 |
41.87 |
| 2010-01-27 |
44.57 |
0.35 |
0.35 |
0.00 |
0.18 |
0.22 |
0.83 |
45.46 |
| 2010-01-28 |
43.42 |
-1.15 |
0.00 |
1.15 |
0.17 |
0.29 |
0.59 |
37.30 |
| 2010-01-29 |
42.66 |
-0.76 |
0.00 |
0.76 |
0.16 |
0.32 |
0.49 |
33.08 |
| 2010-02-01 |
43.13 |
0.47 |
0.47 |
0.00 |
0.18 |
0.30 |
0.61 |
37.77 |
RSI Formulas
The formulas behind the calculations used in the table are:
- First Average Gain = Sum of Gains over the past 14 periods / 14.
- First Average Loss = Sum of Losses over the past 14 periods / 14
All subsequent gains than the first use the following:
- Average Gain = [(previous Average Gain) x 13 + current Gain] / 14.
- Average Loss = [(previous Average Loss) x 13 + current Loss] / 14.
- RS = Average Gain / Average Loss
- RSI = 100 – 100/(1+RS)
Writing the Analytic in q
We can load our data (rsi.csv) in then apply updates at each step to recreate the table above:
Code kindly donated by Terry Lynch
Rather than create all the intermediate columns we can create a calcRsi function like so:
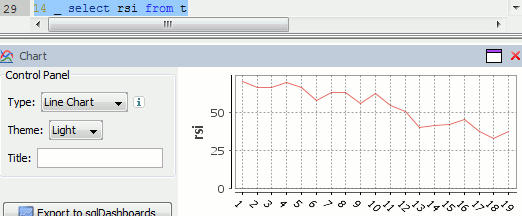
Finally we can visualize our data using the charting functionality of qStudio (an IDE for kdb):
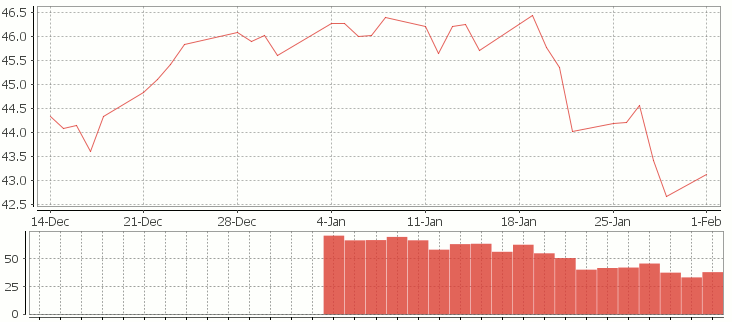
RSI Relative Strength Index stock chart for QQQQ created using qStudio
Or to plot RSI by itself (similar to original article
Writing kdb analytics such as Relative Strength Index is covered in our kdb training course, we offer both public kdb training courses in New York, London, Asia and on-site kdb courses at your offices, tailored to your needs.
March 29th, 2014 by Ryan Hamilton
Let’s look at how to write moving average analytics in q for the kdb database. As example data (mcd.csv) we are going to use stock price data for McDonalds MCD. The below code will download historical stock data for MCD and place it into table t:
Simple Moving Average
The simple moving average can be used to smooth out fluctuating data to identify overall trends and cycles. The simple moving average is the mean of the data points and weights every value in the calculation equally. For example to find the moving average price of a stock for the past ten days, we simply add the daily price for those ten days and divide by ten. This window of size ten days then moves across the dates, using the values within the window to find the average. Here’s the code in kdb for 10/20 day moving average and the resultant chart.
Simple Moving Average Stock Chart Kdb (Produced using qStudio)
What Exponential Moving Average is and how to calculate it
One of the issues with the simple moving average is that it gives every day an equal weighting. For many purposes it makes more sense to give the more recent days a higher weighting, one method of doing this is by using the Exponential Moving Average. This uses an exponentially decreasing weight for dates further in the past.The simplest form of exponential smoothing is given by the formula:

where α is the smoothing factor, and 0 < α < 1. In other words, the smoothed statistic st is a simple weighted average of the previous observation xt-1 and the previous smoothed statistic st−1.
This table displays how the various weights/EMAs are calculated given the values 1,2,3,4,8,10,20 and a smoothing factor of 0.7: (excel spreadsheet)
| Values |
EMA |
|
Power |
Weight |
Power*Weight |
|
EMA (text using previous value) |
| 1 |
1 |
|
6 |
0.0005103 |
0.0005103 |
|
1 |
| 2 |
1.7 |
|
5 |
0.001701 |
0.003402 |
|
(0.7*2)+(0.3*1) |
| 3 |
2.61 |
|
4 |
0.00567 |
0.01701 |
|
(0.7*3)+(0.3*1.7) |
| 4 |
3.583 |
|
3 |
0.0189 |
0.0756 |
|
(0.7*4)+(0.3*2.61) |
| 8 |
6.6749 |
|
2 |
0.063 |
0.504 |
|
(0.7*8)+(0.3*3.583) |
| 10 |
9.00247 |
|
1 |
0.21 |
2.1 |
|
(0.7*10)+(0.3*6.6749) |
| 20 |
16.700741 |
|
0 |
0.7 |
14 |
|
(0.7*20)+(0.3*9.00247) |
To perform this calculation in kdb we can do the following:
(This code was originally posted to the google mail list by Attila, the full discussion can be found here)
This backslash adverb works as
The alternate syntax generalizes to functions of 3 or more arguments where the first argument is used as the initial value and the arguments are corresponding elements from the lists:
Exponential Moving Average Chart
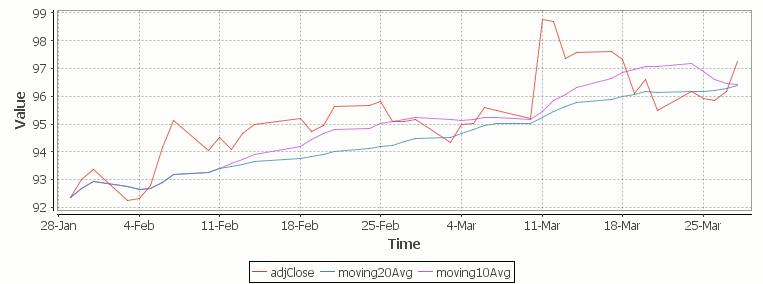
Finally we take our formula and apply it to our stock pricing data, allowing us to see the exponential moving average for two different smoothing factors:
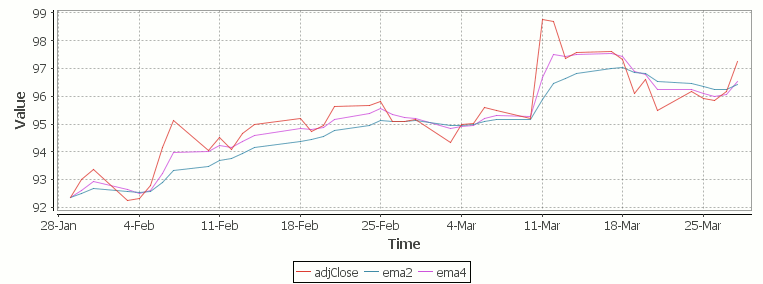
Exponential Moving Average Stock Price Chart produced using qStudio
As you can see with EMA we can prioritize more recent values using a chosen smoothing factor to decide the balance between recent and historical data.
Writing kdb analytics such as Exponential Moving Average is covered in our kdb training course, we regularly provide training courses in London, New York, Asia or our online kdb course is available to start right now.
October 28th, 2013 by John Dempster
Typical feed handlers for kdb+ are for market data and trade data such as bloomberg B-Pipe or reuters market feeds. These feeds typically contain ticker symbol, bid price, ask price and the time. We’ve been working on something a little different, a twitter feed handler. With this feed handler you can subscribe to:
- A random sample of all tweets
- Certain search queries
- Locations, tweets for any trending queries will be downloaded for those areas
For each tweet we have associated meta data that includes: location, language, time of posting and number of favourites/retweets.
Now that we have our data in kdb+ we can analyse it like any other time-series data and look for interesting patterns. If you have worked on anything similar I would love to hear about it (john AT timestored.com). I find treating social media data as time-series data throws up many interesting possibilities, in future blog posts I’ll start digging into the data..
At TimeStored we have previously implemented a number of market data feed handlers. Handling reconnections, failover, data backfilling and data enrichment can be a tricky problem to get right, if you need a feed handler developed we provide kdb+ development, consulting and support services, please contact us.
Basic examples of Java kdb+ Feed handlers and C Feed Handlers are available on the site.