QStudio 5.0 is now Open Source after 13 years of development!
QStudio remains a fast, modern SQL editor supporting over 30 databases including MySQL, PostgreSQL, DuckDB, QuestDB, and kdb+/q. Version 5.0 continues our focus on performance, analytics and extensibility now with an open community behind it.
🎉 QStudio Is Now Open Source
After 13 years of development, QStudio is now fully open source under a permissive license. Developers, data analysts and companies can now contribute features, inspect the code, and build extensions.
Open Source Without the Fine Print.
No enterprise edition. No restrictions. No locked features. QStudio is fully open for personal, professional, and commercial use.
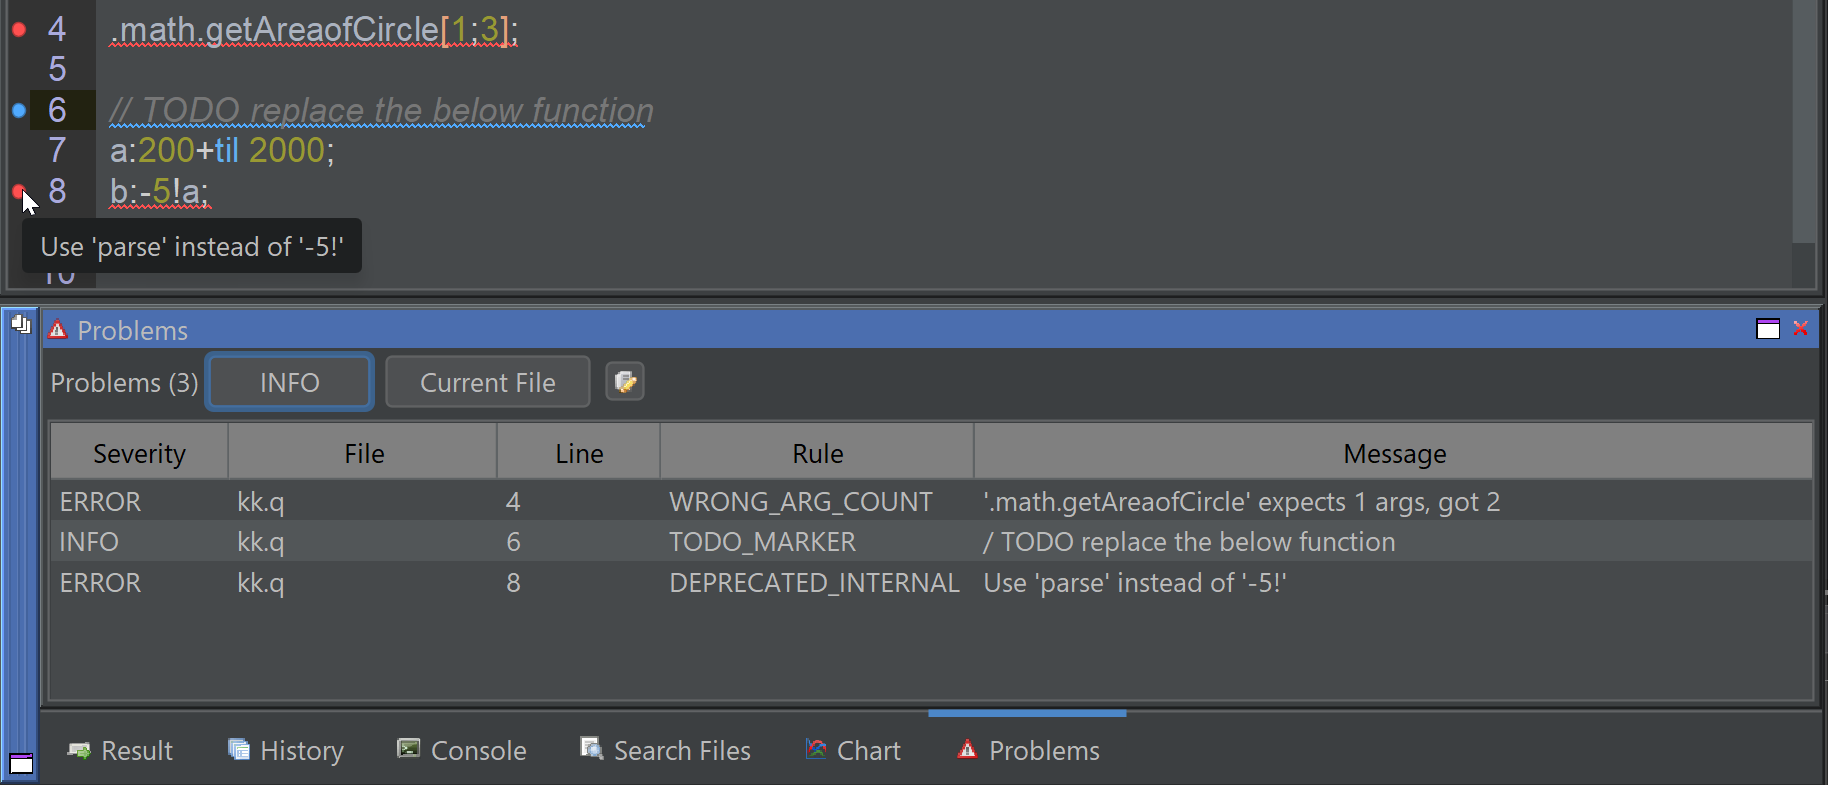
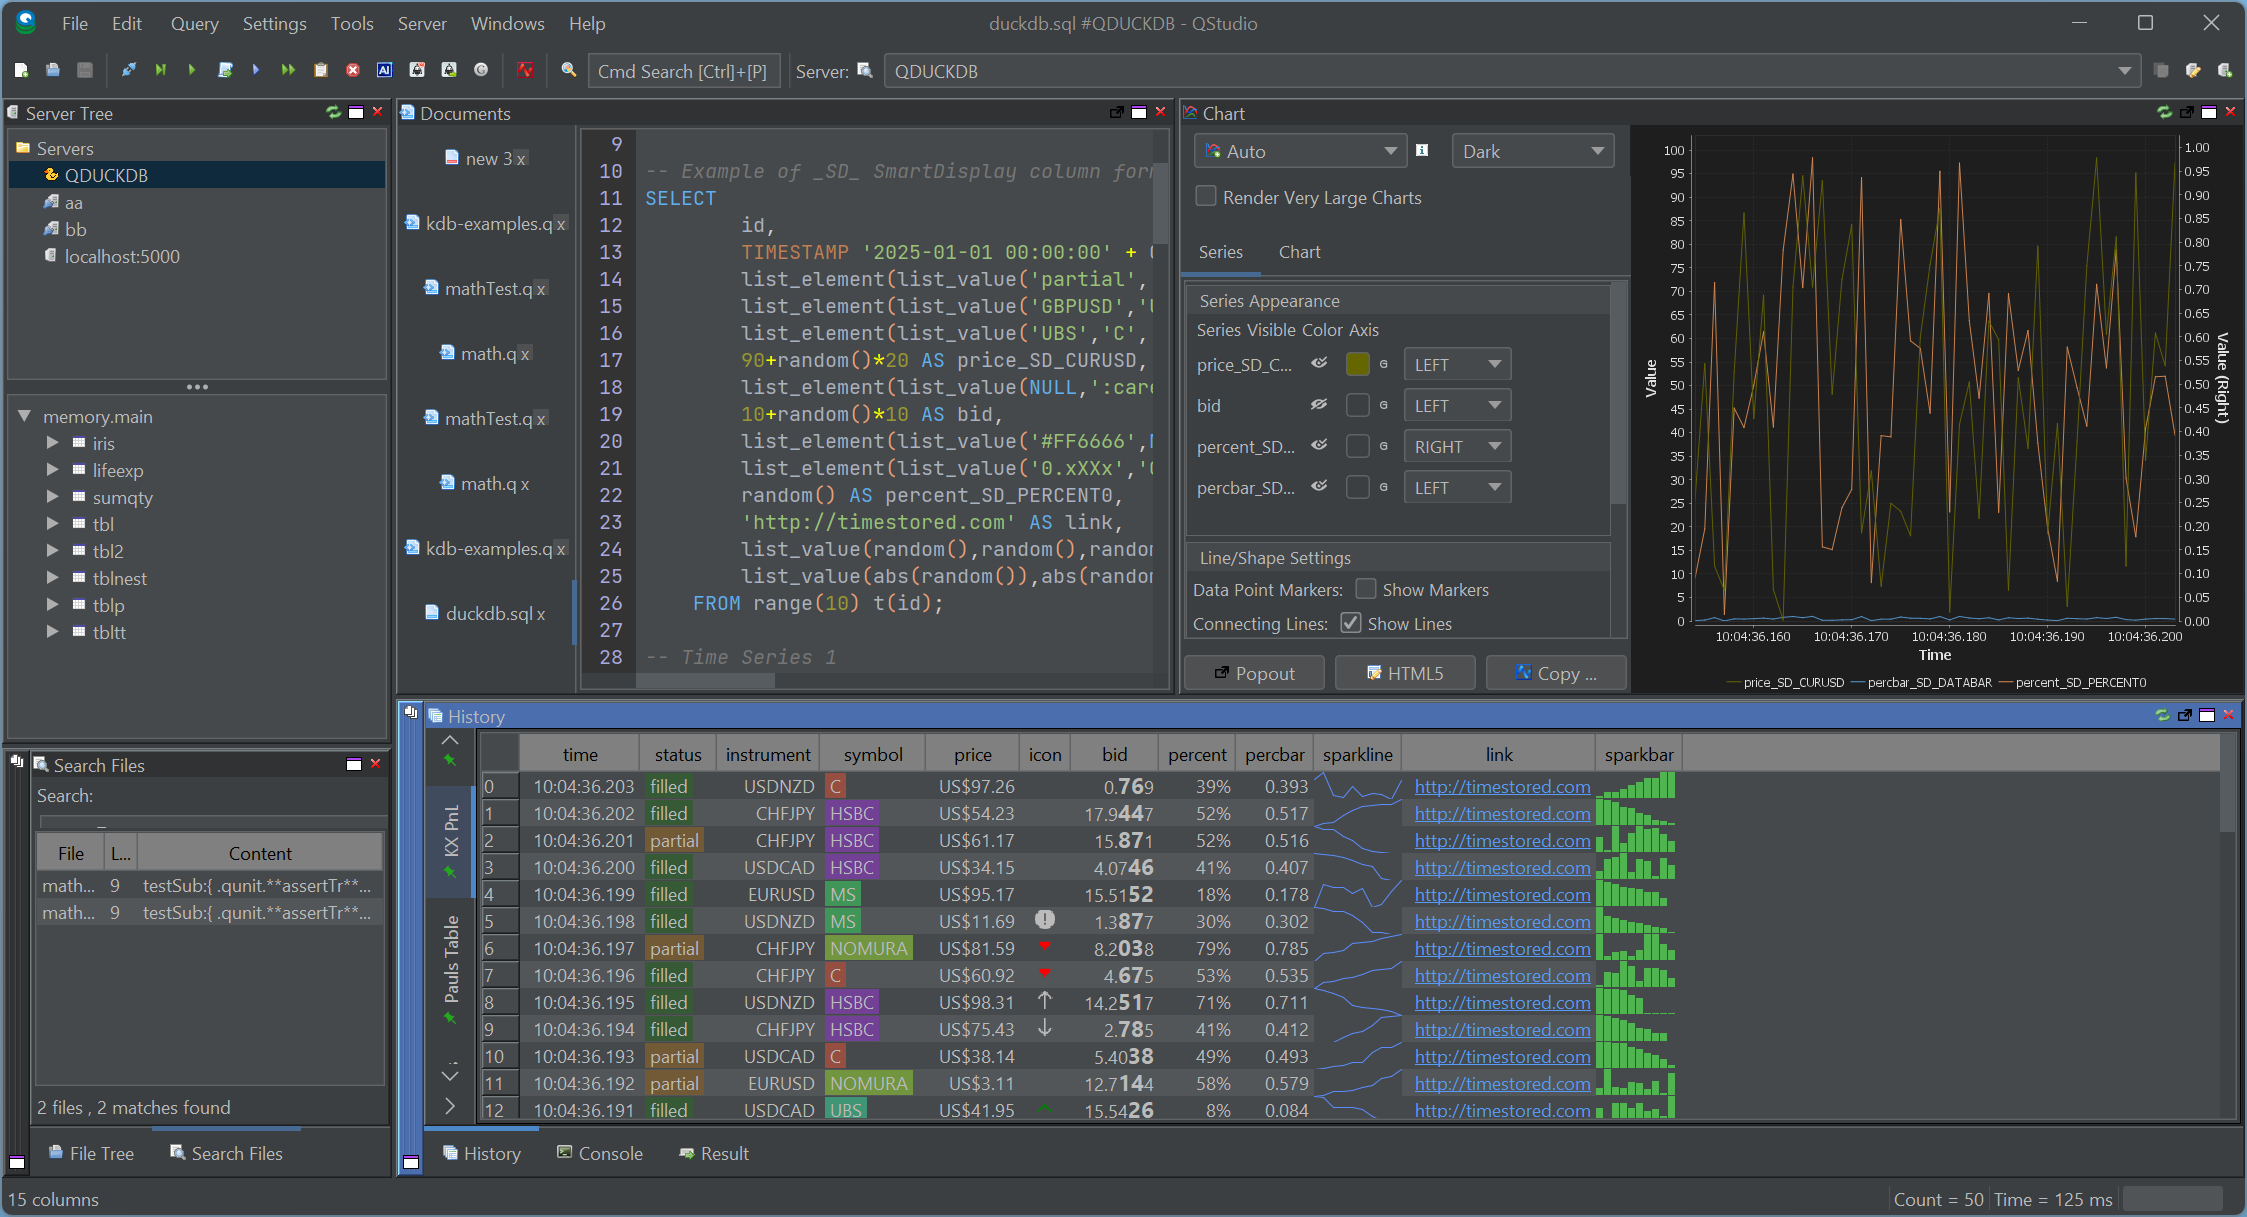
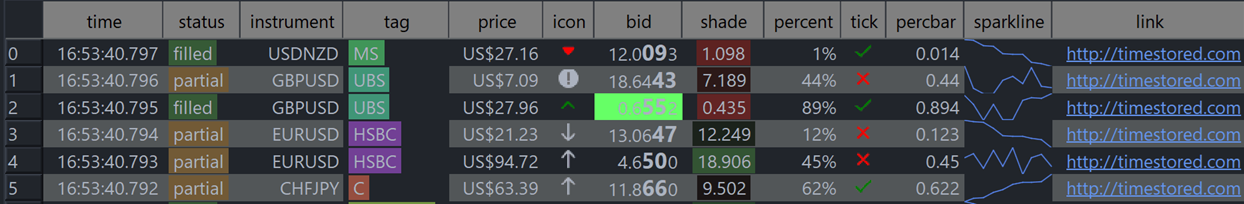
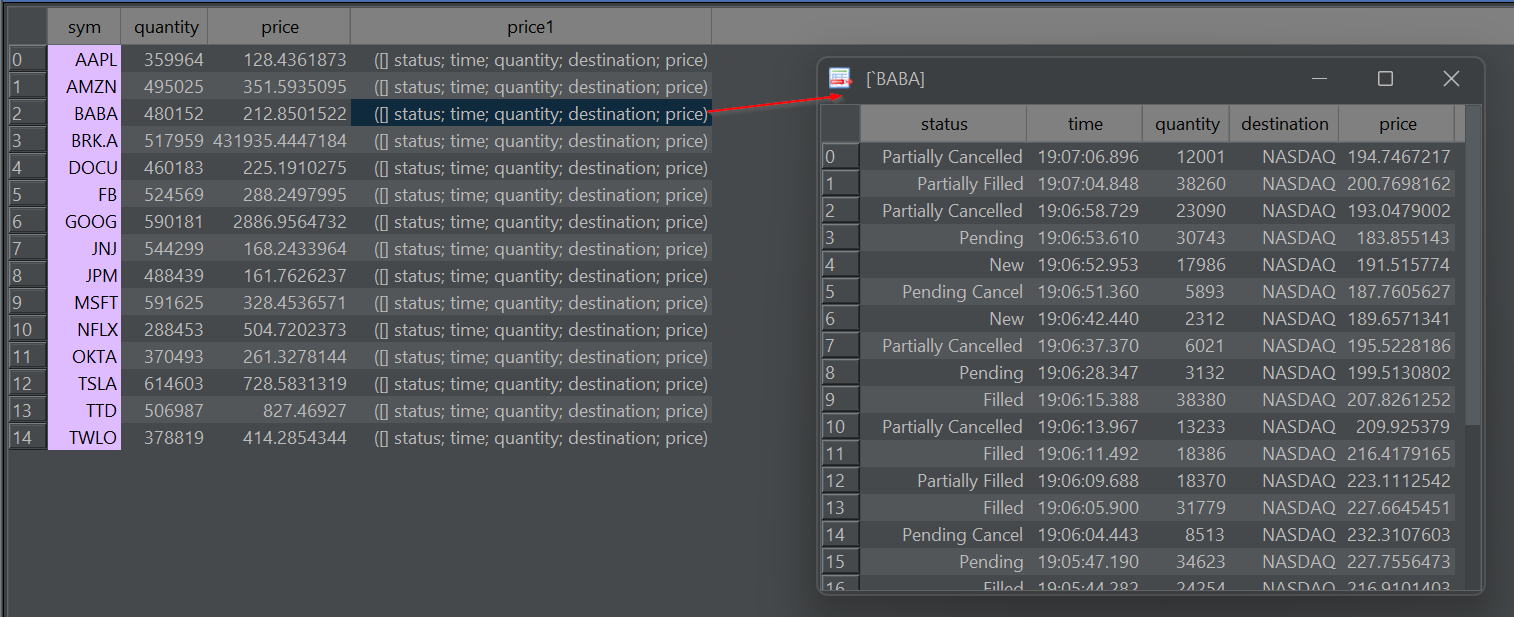
New Table Formatters, Better Visuals, Better Reporting
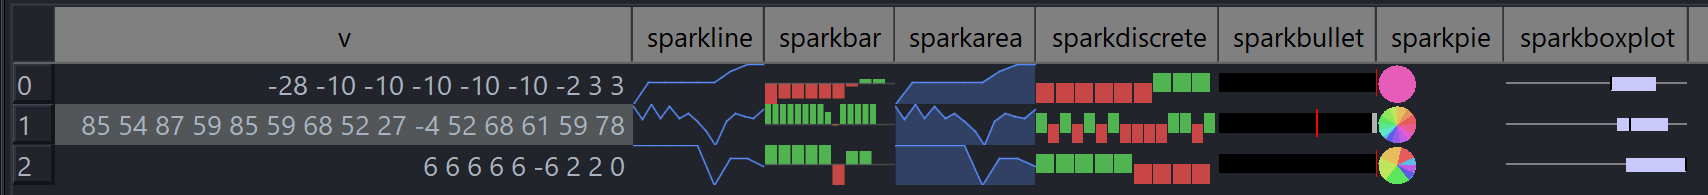
SmartDisplay is QStudio’s column-based automatic formatting system. By adding simple _SD_* suffixes to column names, you can enable automatic number, percentage, and currency formatting,Sparklines, microcharts and much more. This mirrors the behaviour of the Pulse Web App, but implemented natively for QStudio’s result panel.
Spark Lines + Micro Charts
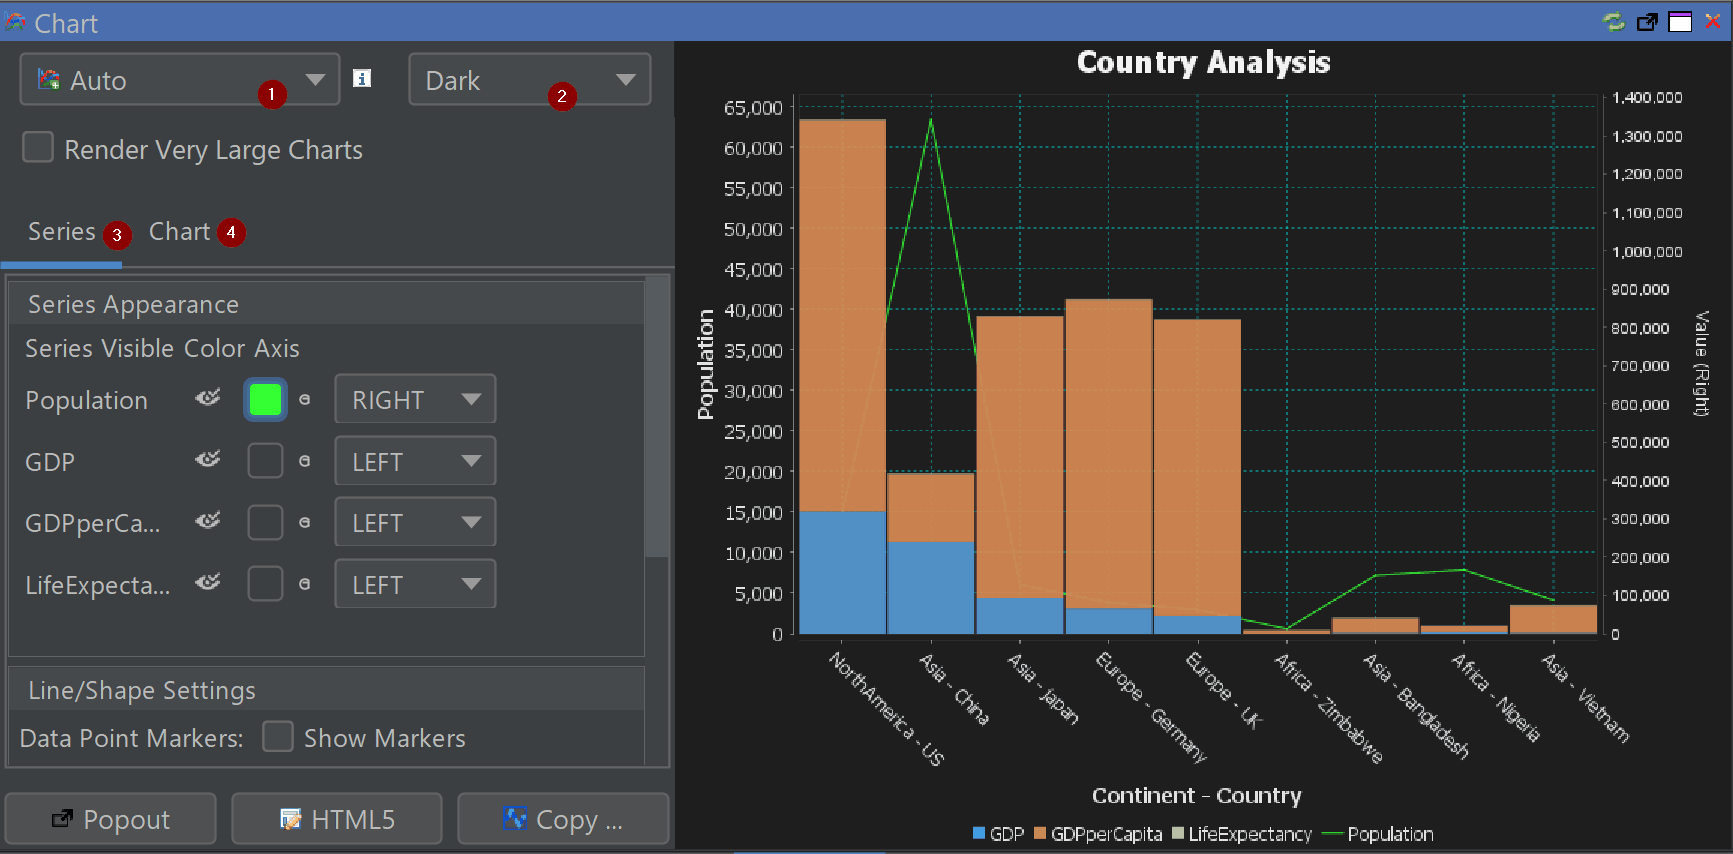
Comprehensive Chart Configuration
Fine-tune axes, legends, palettes, gridlines and interactivity directly inside the chart builder.
New Chart Themes
Excel, Tableau and PowerBI-inspired styles for faster insight and cleaner dashboards.
Other Major Additions
Back / Forward Navigation — full browser-like movement between queries.
Smart Display (SD) — auto-formats tables with min/max shading and type-aware formatting.
Conditional Formatting — highlight rows or columns based on value rules.
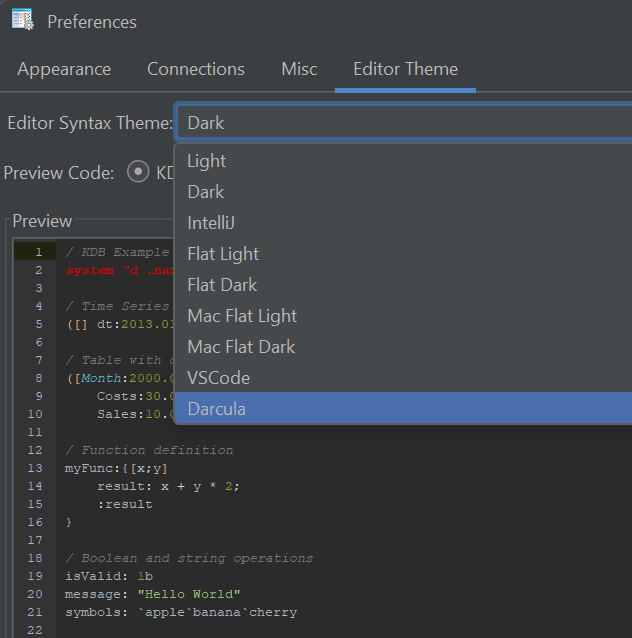
New Code Editor Themes — dark, light and popular IDE-style themes.
Extended Syntax Highlighting — Python, Scala, XPath, Clojure, RFL, JFlex and more.
Improved kdb+/q Support — nested / curried functions now visible and navigable.
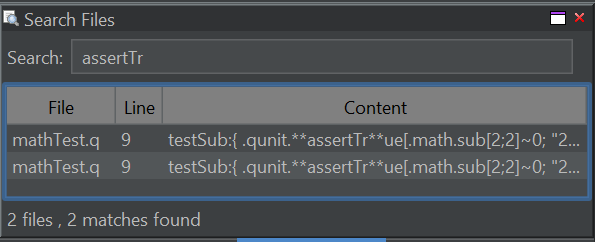
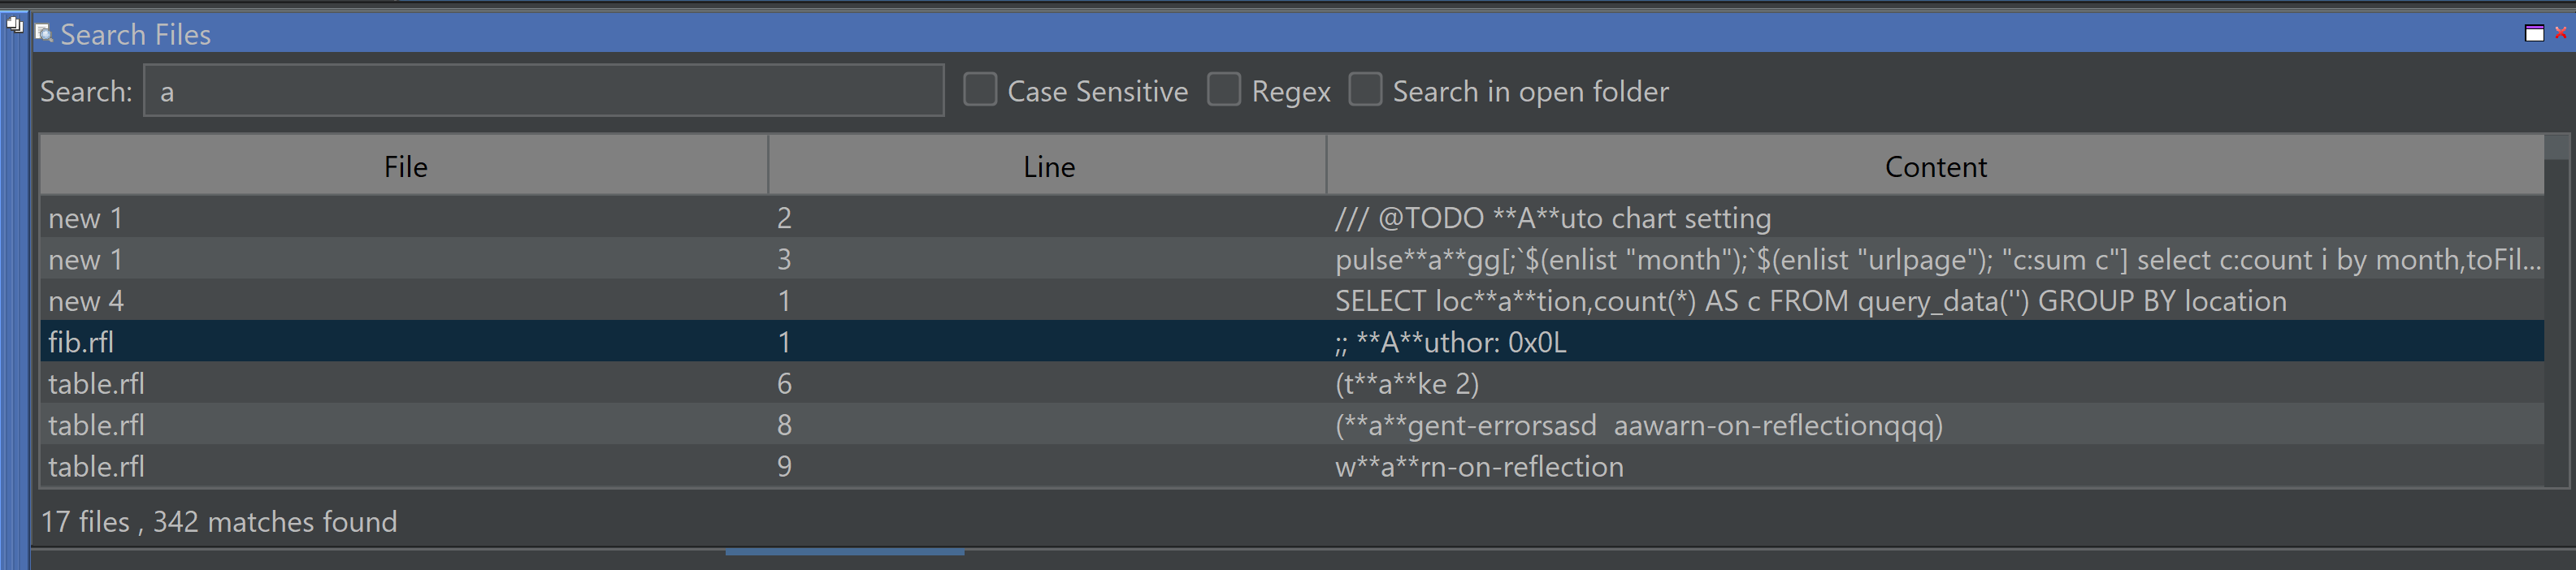
Search All Open Files (Ctrl+Shift+F)
Navigation Tabs in Query History — with pinning.
Improved Chinese Translation
DuckDB Updated to latest engine.
Hundreds of minor UI and performance improvements
Legacy Java Removed — cleaner, modern codebase.
Code Editor Improvements
Better auto-complete, themes and tooling for large SQL files.
Pinned Results
Pin results within the history pane for later review or comparison.
Search Everywhere
Control+Shift+F to search all open files and your currently selected folder.
Our History
2013–2024: QStudio provided syntax highlighting, autocomplete, fast CSV/Excel export and cross-database querying.
Version 2.0: QStudio expands support to 30+ Databases.
Version 3.0: Introduced DuckDB integration, Pulse-Pivot, Improved export options.
Version 4.0: Introduced SQL Notebooks and modern visuals.
Version 5.0: Open Source + hundreds of improvements across charts, editing, navigation and data analysis.
We aim to create the best open SQL editor for analysts and engineers. If you spot a bug or want a feature added, please open an issue
QStudio 4.09 introduces a number of new features to make exploring data easier than ever.
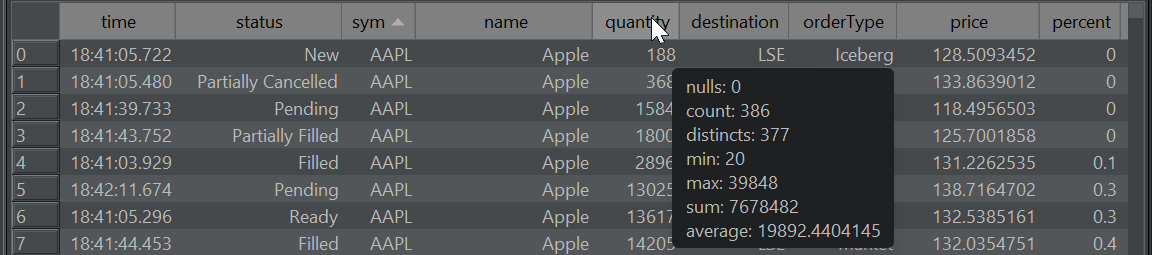
Column Stats
Allows getting a count of nulls, averages and how many distinct values a column contains by hovering the column header:
Transposed row(s)
Have a very wide table? Want to quickly see all the column?
Transpose from a row to column based layout for those rows. Allowing you to quickly see all values:
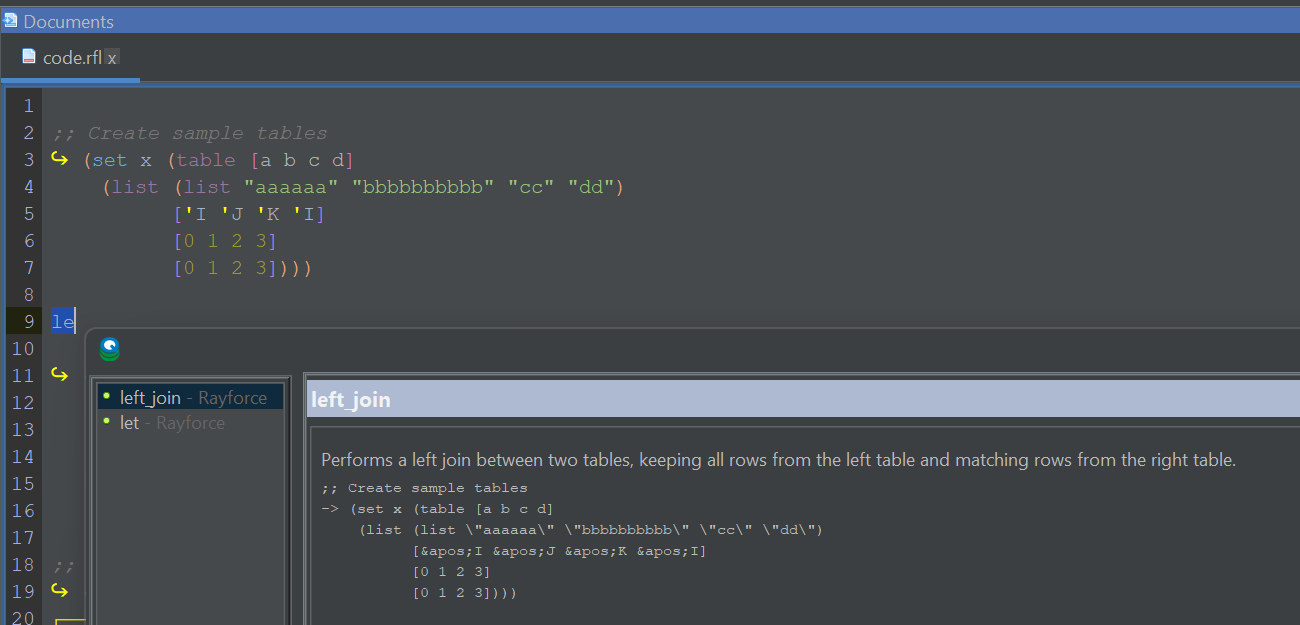
Dive-into Nested Results
Double-click on a nested array or kdb structure (table/dict) to pop-out a table showing only the nested item. You can repeat this to dig deeper and deeper into nested data. (Thanks to Oleg/QPad on pioneering this idea).
As well as these new features, a large number of bugs were fixed:
4K Monitor support was significantly improved. You have the option to scale the full UI in preferences.
Apple Mac got a dedicated release and custom App download.
2025-04-22 – 4.08 – Bugfix: Candlestick charts were wrong as receiving wrong timezone from kdb driver. Timezone now set to UTC.
– Bugfix: “Save as” to .sql was shrinking text. Now fixed.
– Bugfix: Show red X close on every document tab.
2025-04-06 – 4.07 – Add UI Scaling and Font size as separate options to help with 4K monitors
– Bugfix: Kdb+ Queries with errors could cause 30 second freezes.
– Bugfix: Switch back to MonoSpaced font. Variable width fonts cause wrong caret position.
– Improved high resolution QStudio icon.
– Mac: Bugfix: Prefences dialog fixed and allows choosing font.
– Mac: Fixed Menu shoing about/preferences/exit.
– Mac: Allow Command+Option+E to run current query.
– 4K handling improved sizing of dialogs.
– Bugfix: Improved duckdb init when folder is empty.
2025-03-13 – 4.06 – Add ability to transpose rows.
– DuckDB 1.2.1. Improve display of DuckDB arrays.
– Add comma separator for thousands option.
2025-02-23 – 4.05 – Upgrade kdb+ c/jdbc.java to allow SSL TLS.
– Add preference to allow hiding all tooltips.
– Double-click on kdb+ table with dictionary/table/list nested in cell will pop it out.
2025-01-23 – 4.04 – Show column info (avg/min/max) when column header is hovered.
– Remove watched expressions entirely.
– Improved UI threading for tree/chart display.
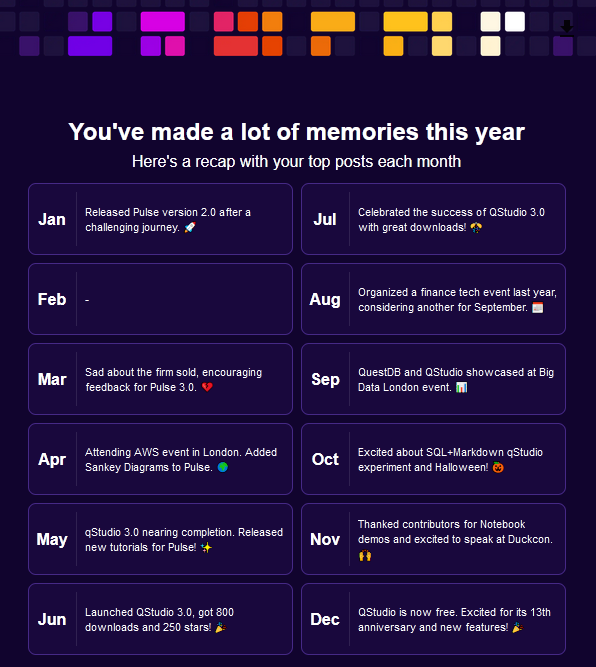
2024 has been a good year with new major versions of both QStudio and Pulse released. 1000s of new users using our tools and we continue to release regularly and keep improving. Thanks go to our users for raising issues, providing feedback and commercially backing us.
QStudio is now 100% Free. No registration or license required.
Why? Are you shutting down?
Quite the opposite, we believe free and open source is the future and that is where we are going.
If anything we want customers to take this as a massive thanks.
Thank you for being part of driving QStudio forward and sponsoring development and cheering us along all these years.
Thanks in particular to
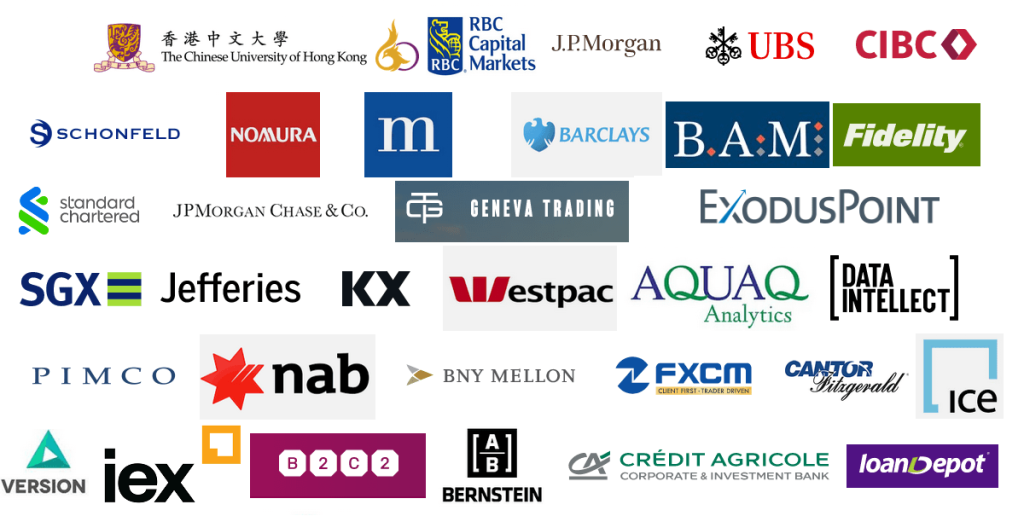
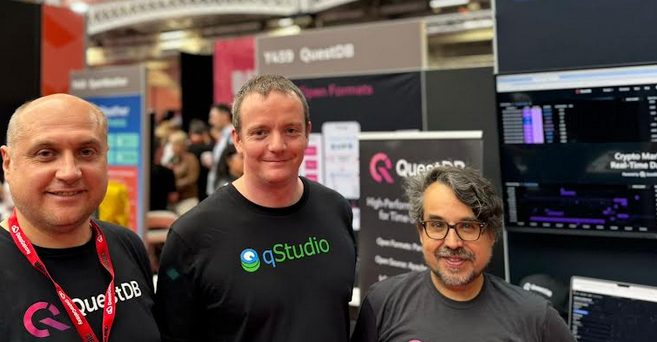
Thanks in particular to the large finance firms that took a chance on us. Big firms can be bureaucratic with onboarding, purchasing policies, vendor lists, 30 page contracts so I want to thanks all those individuals that jumped those hurdles to get us onboarded and those that put it on the corporate credit card. Below this post is an image containing what may or may not be some customers and other firms that have provided feedback, assistance and input over the years. Strictly speaking we are not allowed to confirm nor deny customers.
What I would say as an external party is that on average these places knew how to complete paperwork, get out of staffs way and enable them to get work done so they are probably better places to work on average.
Over the years, a few larger firms failed to onboard as those attempting it were ground down under the paperwork.
The good news for them is that QStudio is now free and the paperwork should be halved!
If you have any bugs, issues or feedback to report please join us on github
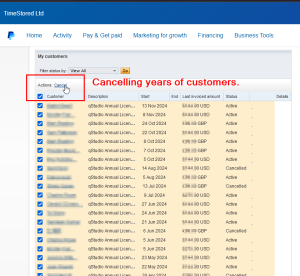
This is me cancelling all the individual users that paid annually for QStudio after 10+ years of building them up! Similarly all corporate contracts are also terminated.
Thanks
Note: For those who recently renewed we are offering a Free Pulse license for 10x the users you purchased for QStudio. Get in touch for a demo.
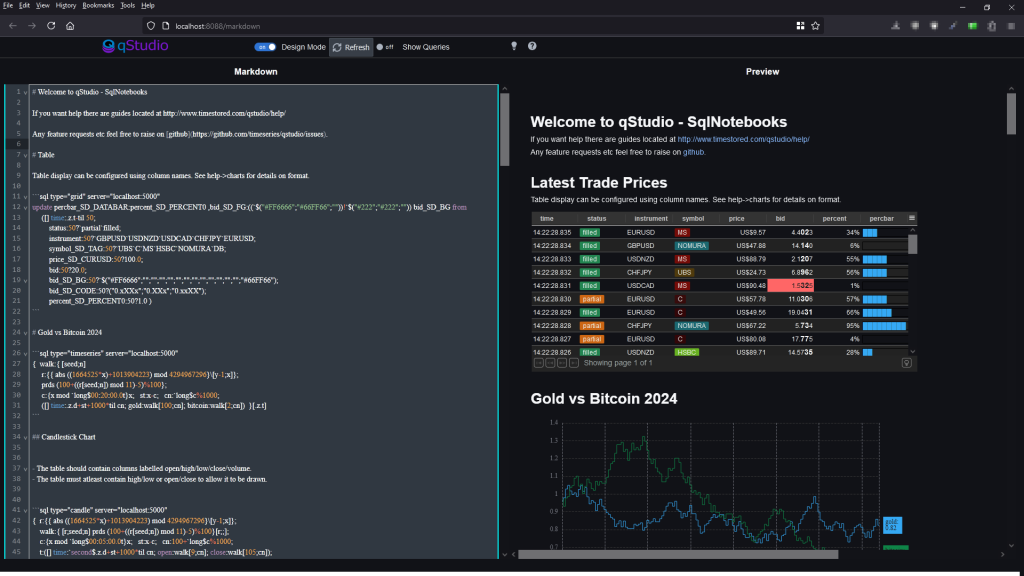
Want to create beautiful live updating SQL notebooks?
While being able to easily source control the code?
and take static snapshots to share with colleagues that don’t have database access?
Today we launched exactly what you need and it’s available in both:
QStudio Version 4 – Desktop SQL Client entirely based on editing markdown files locally.
Pulse Version 3 – As a shared team server, where users only need a web address to get started and share results.
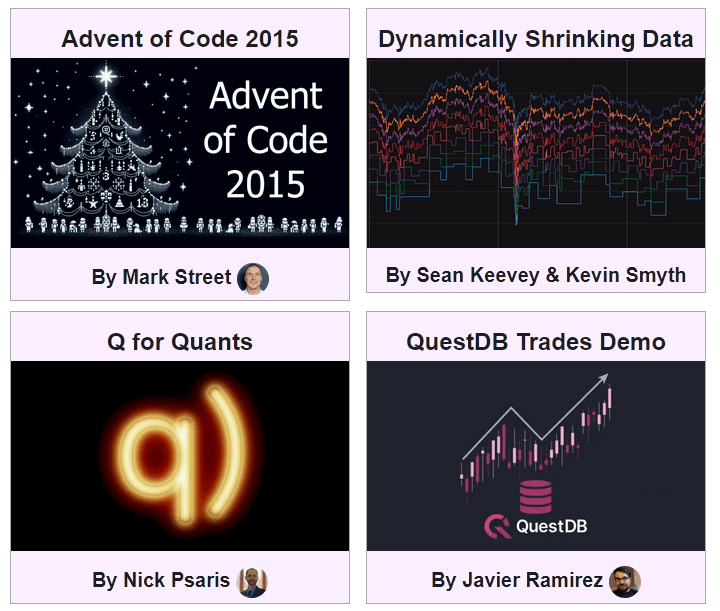
SQL Notebook Examples
We have worked with leading members of the community to create a showcase of examples.
These are snapshotted versions with static data. The source markdown and most the data to recreate them are available on github.
Let us know what you think, please report any issues, feature suggestions or bugs on our github QStudio issue or Pulse issue tracker.
Thanks to everyone that made this possible. Particularly Brian Luft, Rich Brown, Javier Ramirez, Alexander Unterrainer, Mark Street, James Galligan, Sean Keevey, Kevin Smyth, KX, Nick Psaris and QuestDB.
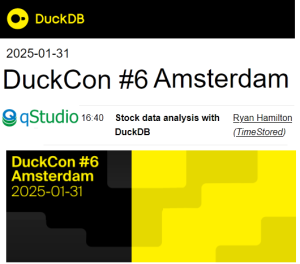
DuckDB has skyrocketed in the last year and Amsterdam is it’s home. QStudio will be there in 2025.
31st January 2025 – 16:40 Stock data analysis with DuckDB
One year ago we decided to bundle DuckDB as we thought it was awesome. A free column oriented database that can open local databases and perform ASOF joins at speed! We knew QStudio users would love it. This year Ryan is excited to be speaking at Duckcon #6 in Amsterdam.
SQL+Markdown qStudio experiment 🚀 🚀 Quick report creation with nice git code commits.
If this is something that interests you, message me.
Particularly if you have tried other notebooks and hold strong opinions 😡 .
At TimeStored we are constantly running experiments with both Pulse and qStudio with small groups of users to see what new ideas may provide value. Most fail. They don’t always work out or they don’t gather enough interest to be viable but we think SQLMarkdown might be a winner. We are already finding it useful for our own workflows.


If this is something that interests you, message me.
Particularly if you have tried other notebooks and hold strong opinions 😡 .