Archive for the 'timeseries' Category
January 2nd, 2025 by Ryan Hamilton
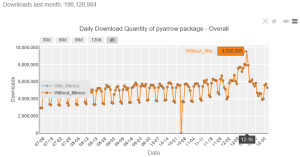
PyArrow dowloads
- Open source tools are now as performant as pre-existing commercial offerings for data analysis and in many ways offer more features.
Proof: See the time-series benchmarks and note how many are open source: https://www.timestored.com/data/time-series-database-benchmarks
- Everyone has discovered that column-oriented storage and vector execution is the secret to fast analytics.
- Arrow format has won. It is now a cornerstone technology used in python, numpy, polars, duckdb, R.
Pandas replaces numpy with arrow, DuckDB quacks arrow, QuestDB will support arrow, InfluxDB (2023), Polars is built upon Apache Arrow.
- Apache parquet has won as the lowest common denominator for basic data storage.
QuestDB queries parquet, DuckDB supports parquet (2021), Clickhouse , GreptimeDB uses Arrow and Parquet.
- Iceberg vs Delta vs Hudi. Iceberg won. AWS announcement.
Trends of 2024
DuckDB is on course to become the defacto column oriented database that all others will be compared to.
Clickhouse conquered a number of enterprises but difficuly deploying and getting started now seem like key factors that held it back.
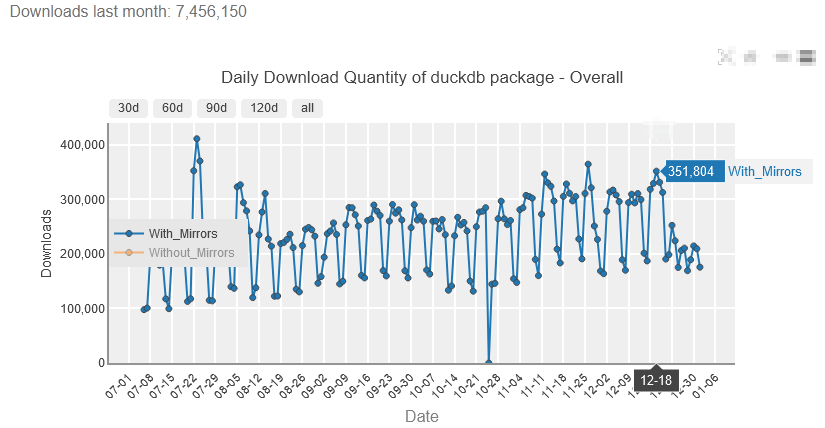
DuckDB Downloads
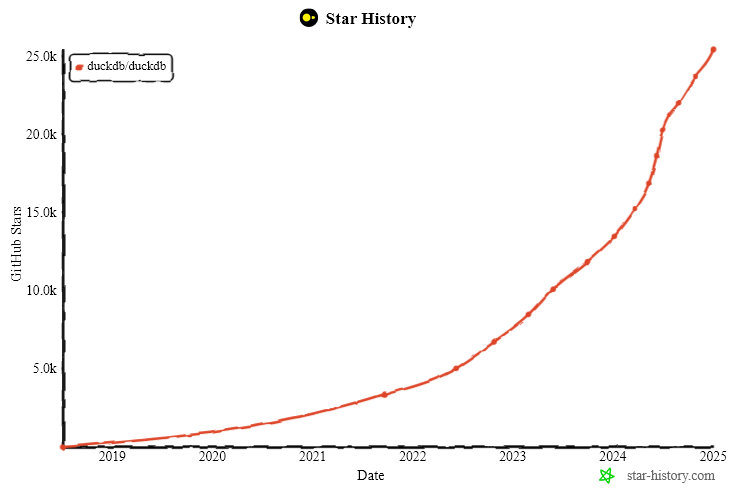
DuckDB Stars
Underlying Factors
Why has SQL and python won? In many ways these are terrible languages (GIL , SET theory) but they won? I can’t say all the reasons but some things that I believe worked in favour:
- Open Source + Free = Hard to beat. We’ve seen open-source companies (license disputes mentioned below) take over every area. VCs and startups have realised making big money selling dev tools requires solving two problems: distribution + technology and the harder one is now distribution. The important thing is getting your product into the hands and heads of as many people as possible. Once there, you can withhold all useful enterprise features and charge for them, assuming AWS doesn’t try the same trick. I do wonder if this is causing the death of otherwise small viable software bsuinesses.
- Google = a second brain that worked on keyword search. Languages that had judicial overloading are harder to search than languages with many function names. Google makes it easier to find uniquely named functions that python has. Does anyone still read the manual? nevermind the 500+ page language bibles that were the only way to learn languages 20 years ago?
- AI – It hasn’t been a factor to date but AI is similar to the google benefit but even more. The more data and usage, the more chance AI can write your code, write your query etc. Will this reinforce the benefit that fully expanded syntax and popularity already provides? APL could be even more dead than it is already.
November 8th, 2024 by Ryan Hamilton
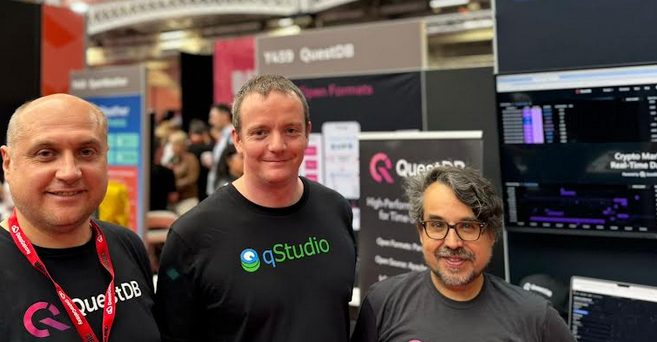
Ryan attended Big Data LDN in September, the highlights were:
- Meeting the QuestDB team in-person and seeing their talk live.
- Listening this talk on modern data lake data formats.
- Complaining to Jonny Press and Gary Davies about over 50% of the hall being AI dominated.
August 16th, 2024 by Ryan Hamilton
DolphinDB and TimeStored working in partnership. Customization of qStudio can be found here.
Contents below.
DolphinDB, a leading provider of the real-time platform for analytics and stream processing, and TimeStored, a pioneering company in the field of data visualization and analytics, are proud to announce a partnership focused on advancing data visualization in quantitative finance. With an emphasis on integrating DolphinDB’s capabilities into TimeStored’s flagship products, qStudio and Pulse, this partnership aims to deliver innovative enhancements to complex analysis scenarios including quantitative trading, high-frequency backtesting, and risk management.
In the competitive field of quantitative trading, a high level of precision in data analysis is essential. Rivals are constantly striving to boost productivity and efficiency to obtain a competitive edge in the dynamic financial markets. To meet this challenge, DolphinDB is committed to providing cutting-edge real-time analytics tools to people worldwide. It offers a unified platform with over 1500 built-in features and a collection of stream computing engines for data warehouse, analytics, and streaming applications. Because of its exceptional efficiency in investment research, DolphinDB has emerged as a significant technology pillar in key areas including strategic research, risk control, and measurement platforms.
Data visualization is intrinsically intertwined with data analysis, serving as an indispensable partner in the exploration of complex datasets and the extraction of valuable insights. By deeply integrating DolphinDB’s efficient investment research capabilities with TimeStored’s advanced visualization technology, we have constructed a scenario which can intuitively display complex financial data. By transforming abstract financial data into intuitive charts and indicators, we significantly enhanced the readability of information and the efficiency of decision-making. It not only meets the current financial market’s demand for data transparency and immediacy but also provides a powerful analysis and decision-support platform for financial professionals. This empowers them to quickly seize opportunities and effectively manage risks in the volatile market.
The latest update to qStudio introduces powerful new features: DolphinDB syntax highlighting, code completion, and a server tree view. These enhancements significantly streamline developers’ workflow, offering intuitive coding and improved navigation. Moreover, the partnership has enabled the visualization of DolphinDB data within TimeStored’s Pulse product. It opens up new horizons for users interested in streaming data visualization, enabling a dynamic and interactive approach to analyzing real-time data.
This partnership leverages the technological strengths of both companies to revolutionize data management. DolphinDB and Timestored are committed to delivering the top-tier solutions for data analysis and quantitative investment research experience to global market participants.
About DolphinDB
Founded in 2016, DolphinDB is committed to providing users worldwide with cutting-edge real-time analytics platforms. Our flagship product, DolphinDB, offers a unified platform for data warehouse, analytics, and streaming workloads. At its core, it is a high-performance distributed time-series database. With a fully featured programming language, over 1500 built-in functions, and a suite of stream computing engines, DolphinDB enables rapid development of high-performance applications for mission-critical tasks in global financial institutions.
As an enterprise-focused real-time analytics provider, we take pride in enabling organizations to unlock the value of big data and make smarter decisions through real-time insights into their most demanding analytical workloads.
About TimeStored
TimeStored specializes in real-time interactive data tools, offering robust solutions since 2013. Their products, like Pulse and qStudio, support a wide array of databases and enhance data analysis capabilities. Pulse enables the creation of real-time interactive dashboards, facilitating collaborative data visualization. qStudio, a free SQL analysis tool, features an intelligent SQL editor with functionalities like syntax highlighting and code completion, aimed at improving the efficiency and effectiveness of data analysts.
September 15th, 2023 by admin
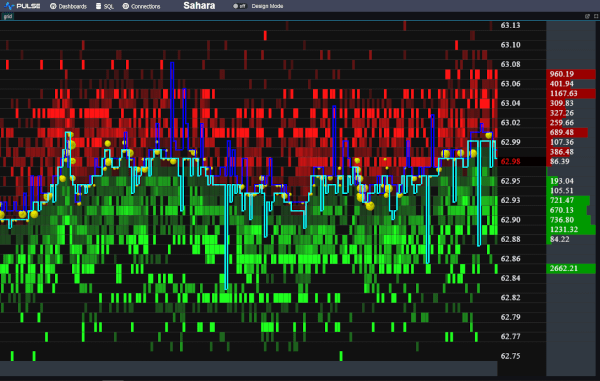
We want to be the best finance streaming visualization solution. To achieve that, we can’t just use off the shelf parts, we have built our own market data order book visualization component from scratch, it’s only dependency is webgl. We call it DepthMap. It plots price levels over time, with the shading being the amount of liquidity at that level. It’s experimental right now but we are already receiving a lot of great feedback and ideas.
Faster Streaming Data
A lot of our users were capturing crypto data to a database, then polling that database. We want to remove that step so Pulse is faster and simpler. The first step is releasing our Binance Streaming Connection. In addition to our existing kdb streaming connection, we are trialling Websockets and Kafka. If this is something that interests you , please get in touch.
August 15th, 2023 by Ryan Hamilton
Our latest product Pulse is for displaying real-time interactive data direct from any database. To get most benefit, the underlying databases need to be fast (<200ms queries). For our purposes databases fall into 2 categories:
- Really really fast, can handle queries every 200ms or less and seamlessly show data scrolling in
- All Other Databases. The 95%+.
It’s very exciting when we find a new database that meets that speed requirement. I went to the website, downloaded QuestDB and ran it. Coming from kdb+ imagine my excitement at seeing this UI:
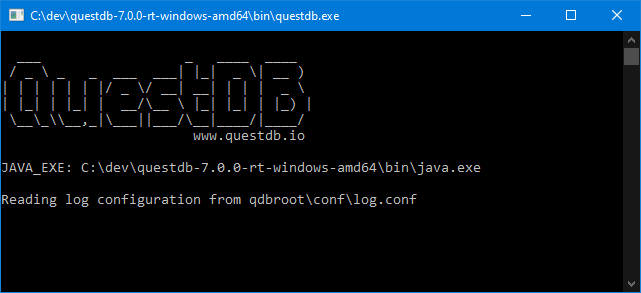
Good News:
- A very tiny download (7MB .jar file)
- There’s a free open source version
- They are focussed on time-series queries
- Did I mention it’s fast
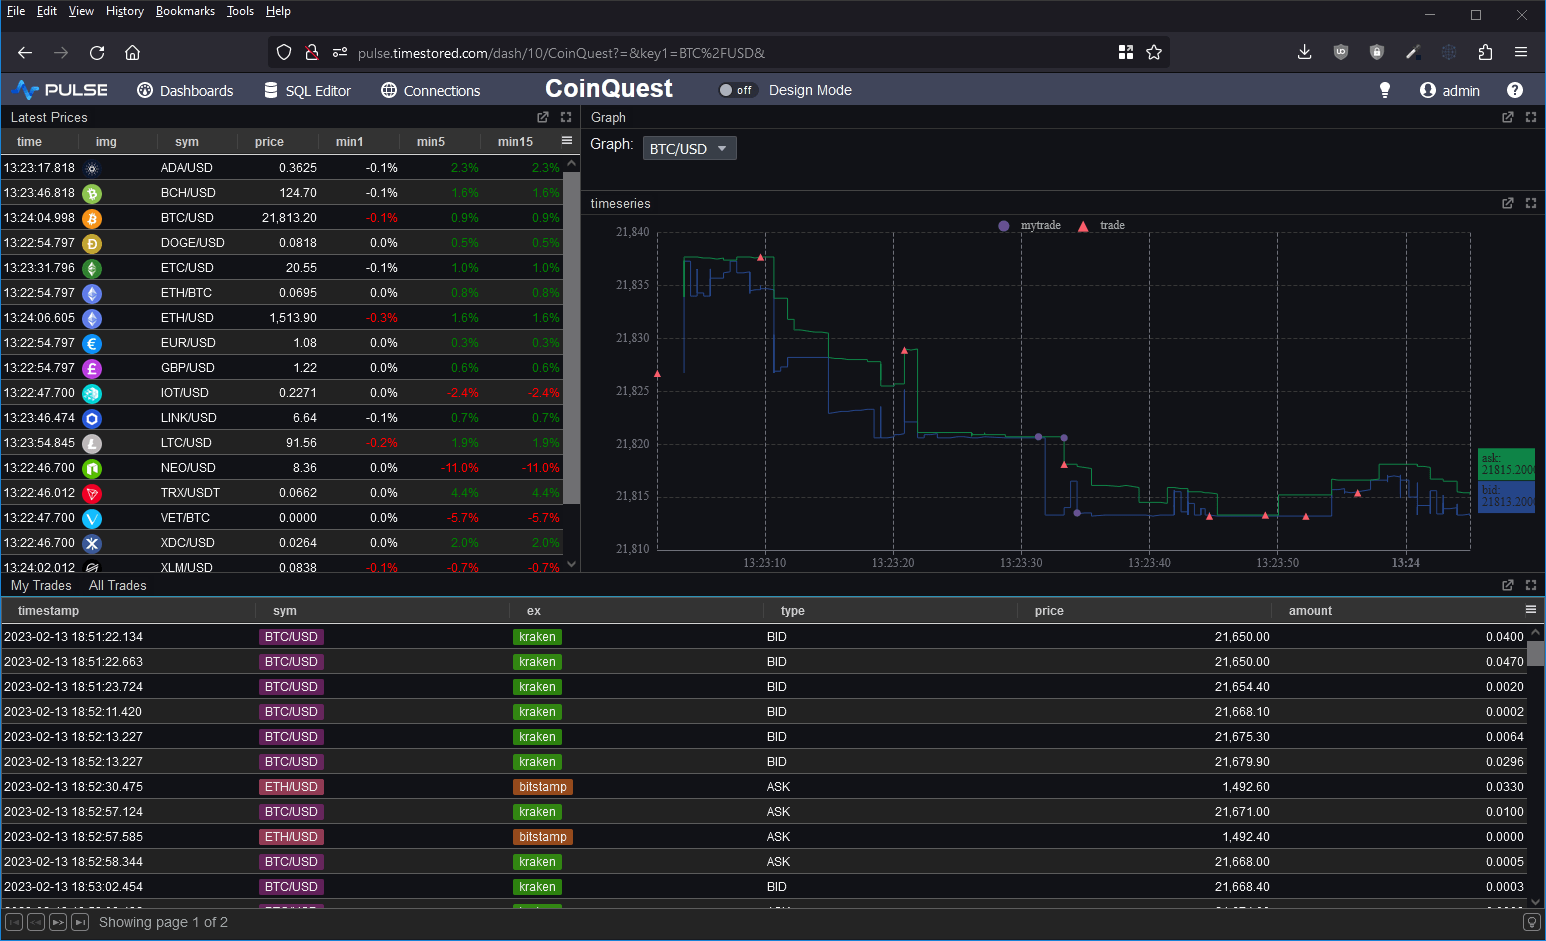
I wanted to take it for a spin and to test the full ingestion->store->query cycle. So I decided to prototype a crypto dashboard. Consume data from various exchanges and produce a dashboard of latest prices, trades and a nice bid/ask graph as shown below.
Good Points
- It simply worked.
- QuestDB chose to be PostgreSQL wire and query compatible. A great technical choice as:
- It will work with many tools including Pulse without complication
- Many people already know SQL. I’ve been teaching q/kdb for years and when people learn it, you can use it for absolutely amazing things that standard SQL is terrible at. However most people do not reach that level of expertise. By using standard SQL more people can reuse their existing knowledge.
- They then added Time-series specific extensions ontop for querying, including:
- “Latest on” – that’s equivalent to kdbs “last by”. It’s used to generate the “latest prices” table in the dashboard with a 1/5/15 minute lag.
- ASOF Joins
- QuestDB can automatically create tables when you first send data, there’s no need to send “Create Table …”. This was useful when I was tweaking the data layout from the crypto feeds.
- At parts my SQL was rusty and I asked for help on their slack channel. Within an hour I got helpful responses to both questions.
Within a very short time, I managed to get the database populated and the dashboard live running. This is the first in a long time that a database has gotten me excited. It seems these guys are trying to solve the same user problems and ideas that I’ve seen everywhere. There were however some significant feature gaps.
Feature Gaps
- No nested arrays. If I want to store bid/asks, I can only currently do it with columns bid1/bid2/bid3, no arbitrary length arrays.
- Very limited window analytics. Other than “LATEST ON” QuestDB won’t let me perform analysis within that time window or within arrays in general.
- I really missed my
`time xasc (uj/)(table1;table2)
pattern for combining multiple tables into one. For the graph I had to use a lengthy SQL UNION.
In general kdb+ has array types and amazingly lets you use all the same functions that work on columns on nested structures. I missed that power.
- No security on connections. It seems security integration will be an enterprise feature.
Open Source Alternative to kdb+ ?
Overall I would say not yet but they seem to be aiming at a similar market and they are moving fast.
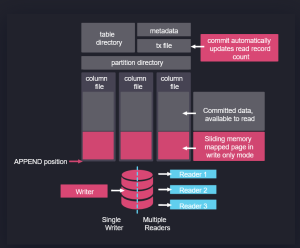
In fact, if you look at their architecture on the right, it’s obvious some of their team have used kdb+. Data is partitioned on date, with a separate folder per table and a column per file. Data is mapped in when read and appended when new data arrives.
In some ways this architecture predates kdb+ and originates from APL. It’s good to see new entrants like QuestDB and apache arrow pick up these ideas, make them their own and take them to new heights. I think kdb+ and q are excellent, I was always frustrated that it has remained niche while inferior technical solutions became massively popular, if QuestDB can take time-series databases and good technical ideas to new audiences, I wish them the best of luck!
Please leave any of your thoughts or comments below as I would love to hear what others think.
If you want to see how to setup QuestDB and a crypto dashboard yourself, we have a video tutorial:
June 26th, 2023 by John Dempster
Over the last few months, I’ve discussed grid components, aggregating and pivoting with a lot of people. You would not believe how much users want to see a good grid component that allows drill down and how strongly they hold opinions on certain solutions. I have examined a lot of existing solutions, everything from excel, to powerBI, Oracle, DuckDB, hypertree, grafana, tableau……. I think I’m beginning to converge these ideas and requests into a pivot table that will be a good solution for our users:
- Like all of our work, it should be really really fast
- It must work with Big Data
- It should be Friendly
- It must allow changing aggregations – e.g. Group by exchange OR group by exchange and sym
- Allow pivoting some calculations – from one column to a breakdown in separate columns
- It must work for all databases.
Well now the proposed interface looks like this:
A lot of the functionality inspiration should be credited to Stevan Apter and HyperTree. Ryan had seen HyperTree and loved the functionality and beautiful kdb only implementation. The challenge was to allow similar functionality for all databases while making it more accessible. We now have a working demo version.
If you love pivot tables and have never got to see your dream grid component come to fruition, we want to build it, so get in touch.
April 2nd, 2018 by admin
Our standard time-series graph interpolates between points. When the data you are displaying is price points, it’s not really valid to always interpolate. If the price was 0.40 at 2pm then 0.46 at 3pm, that does not mean it could be interpreted as 0.43 at 2.30pm. Amazingly till now, sqlDashboards had no sensible way to show taht data. Now we do:
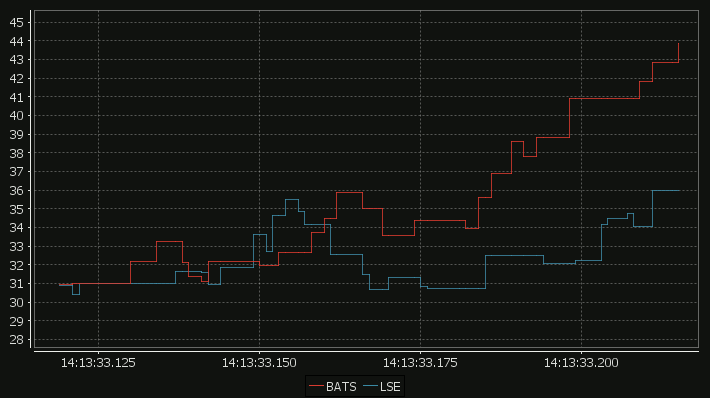
For comparison here is the same data as a time-series graph:
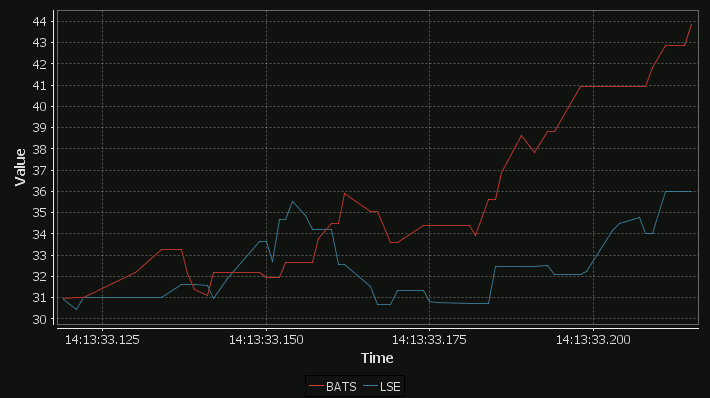
The step-plot is usable for time-series and numerical XY data series. The format is detailed on the usual chart format pages.
November 5th, 2015 by John Dempster
Previously on our blog we had a lively debate about a possibly Open Sourced kdb+ , unfortunately kx now seems to be moving the opposite direction. In a recent announcement they are now restricting “32-bit kdb+ for non-commercial use only”. The timing is particularly unfortunate as:
Alternative (far less enterprise proven) solutions are available:
- MAN AHL have released Arctic an open source Market Data platform based on python and MongoDB
- Kerf Database – A DB aimed at the same market as kdb has now partnered with Briarcliff-Hall and is making greater sales inroads
This renewed interest in kdb alternatives hasn’t so far delivered a kdb+ killer but I fear in time it will.
April 20th, 2015 by Ryan Hamilton
Benchmarking Smart Meter Data Analytics – I got forwarded this interesting paper that compares how quickly smart meter data can be analysed using
- a Relational Database
- Matlab
- An in-memory Column-Oriented database
- Two new NoSQL alternatives
Smart electricity grids, which incorporate renewable energysources such as solar and wind, and allow information sharingamong producers and consumers, are beginning to replace conventional power grids worldwide. Smart electricity meters are afundamental component of the smart grid, enabling automated collection of fine-grained (usually every 15 minutes or hourly) consumption data. This enables dynamic electricity pricing strategies,in which consumers are charged higher prices during peak timesto help reduce peak demand. Additionally, smart meter data analytics, which aims to help utilities and consumers understand electricity consumption patterns, has become an active area in researchand industry. According to a recent report, utility data analytics isalready a billion dollar market and is expected to grow to nearly 4billion dollars by year 2020
January 19th, 2015 by Ryan Hamilton
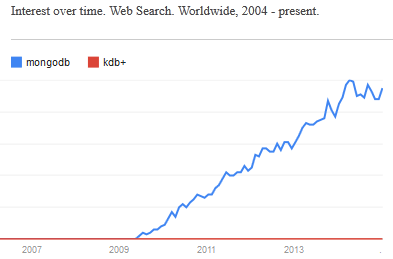
In a world overran with open source big data solutions is kdb+ going to be left behind? I hope not…
Every few weeks someone comes to me with a big data problem often with a half-done mongoDB/NoSQL solution that they “want a little help with”. Usually after looking at it I think to myself
“I could solve this in 20 minutes with 5 lines of q code”
But how do I tell someone they should use a system which may end up costing them £1,000s per core in licensing costs. Yes it’s great that there’s a free 32-bit trial version but the risk that you may end up needing the 64-bit is too great a risk.
Given the ever-increasing number of NoSQL solutions and in particular the rising popularity of Hadoop, R, python and MongoDB it’s not hard to see that open-source is taking over the world. Right now kdb+ still has the edge, that it’s faster, sleeker, sexier..but I don’t think that will save it in the long run. The power of open-source is that it let’s everyone contribute, witness the 100’s of libraries available for R, the 1000’s of javascript frameworks. The truly sad thing is that it’s not always the best underlying technology that wins. A 1000 amateurs creating a vibrant ecosystem of plug-ins, add-ons, tutorials… can beat other technologies through sheer force of numbers.
- APL was a great language yet it remains relegated to history while PHP flourishes.
- PostgreSQL was technically superior to MySQL yet MySQL is deployed everywhere
I believe kdb+ is the best solution to a large number of “big data” problems (small data to kdb+), When you stop and think, time-series data is everywhere, open sourcing kdb+ would open up entirely new sectors to kdb+ and I hope it’s a step kx take before it’s too late.
What do you think? Leave your comments below.