April 10th, 2024 by John Dempster
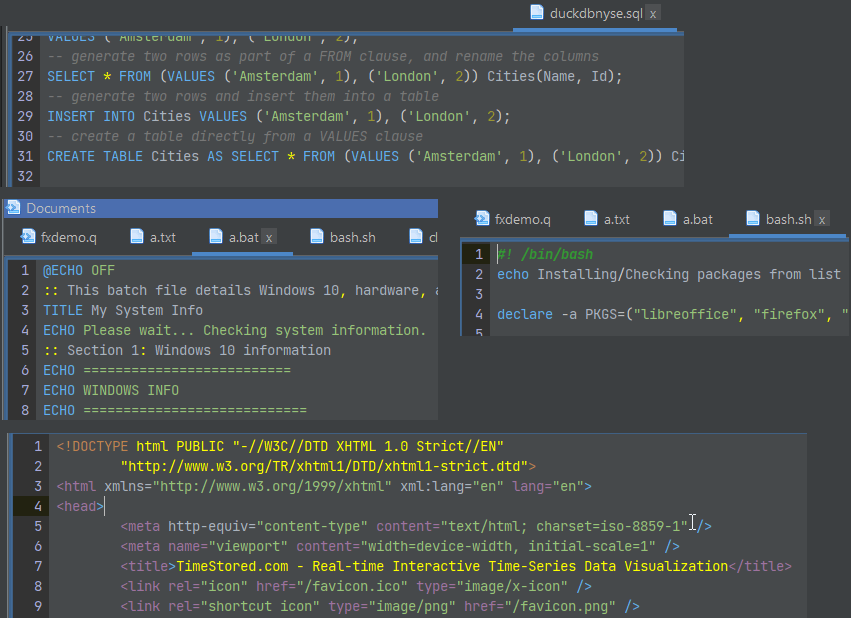
Occasionally you want to edit one other file quickly.
To allow that we’ve added highlighting for:
c, cpp, java, bat, sh, html, js, json, xml and properties files.
April 9th, 2024 by John Dempster

It’s approaching 2 years since we launched Pulse and it’s a privilege to continue to listen to users and improve the tool to deliver more for them. A massive thanks to everyone that has joined us on the journey. This includes our free users, who have provided a huge amount of feedback. We are commited to maintaining a free version forever.
We want to keep moving at speed to enable you to build the best data applications.
Below are some features we have added recently.
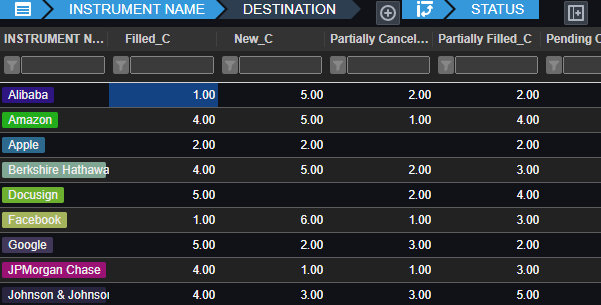
Pulse enables authors to simply write a select query, then choose columns for group-by, pivot and aggregation. Users can then change the pivoted columns to get different views of the data. The really technical cool part is:
- Unlike other platforms, Pulse does not attempt to pull back all data.
- All aggregation of data is performed on the SQL server, making it really fast.
- For kdb+, aggregation and pivoting occur on the kdb+ end using the common piv function.
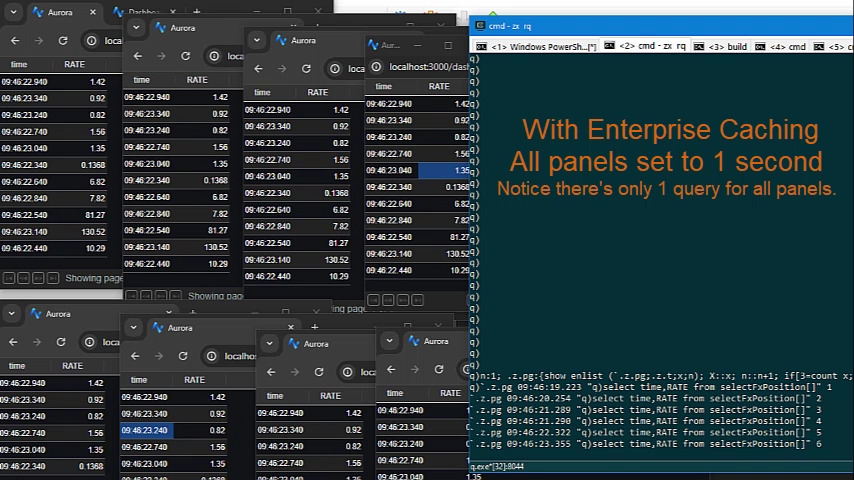
- As we have deployed Pulse at larger firms with more users, the backend databases began to become a bottleneck.
- Polling queries to data sources can now be cached and results reused within the time intervals selected.
- This means whether there are 1, 10 or 100 users looking at the same dashboard with the same variables, it will only query once, not separately for every user.
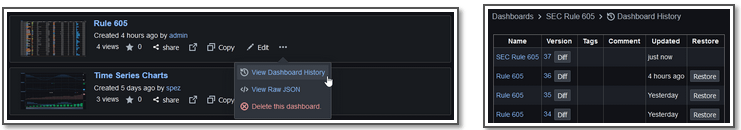
- Pulse has allowed users to open or restore previous versions since version 1.
- Now you can view a diff to see which code or query changed.
- Next we want to add support for file/git based deployment.
- If this is something that interests you, add a note to the issue.
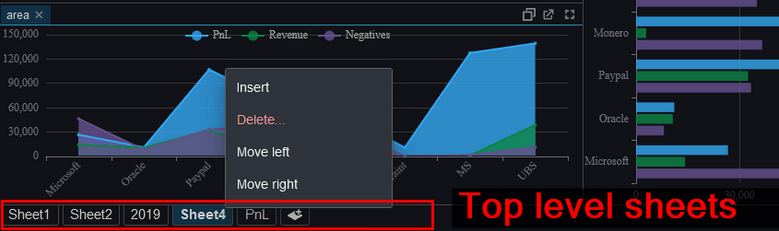
Tabs and Sheets
Pulse now supports both a tabbed interface and top level sheets.
June 26th, 2023 by John Dempster
Over the last few months, I’ve discussed grid components, aggregating and pivoting with a lot of people. You would not believe how much users want to see a good grid component that allows drill down and how strongly they hold opinions on certain solutions. I have examined a lot of existing solutions, everything from excel, to powerBI, Oracle, DuckDB, hypertree, grafana, tableau……. I think I’m beginning to converge these ideas and requests into a pivot table that will be a good solution for our users:
- Like all of our work, it should be really really fast
- It must work with Big Data
- It should be Friendly
- It must allow changing aggregations – e.g. Group by exchange OR group by exchange and sym
- Allow pivoting some calculations – from one column to a breakdown in separate columns
- It must work for all databases.
Well now the proposed interface looks like this:
A lot of the functionality inspiration should be credited to Stevan Apter and HyperTree. Ryan had seen HyperTree and loved the functionality and beautiful kdb only implementation. The challenge was to allow similar functionality for all databases while making it more accessible. We now have a working demo version.
If you love pivot tables and have never got to see your dream grid component come to fruition, we want to build it, so get in touch.
March 27th, 2023 by John Dempster
qStudio release 2.05 added:
- Mac / Intellij / Flat / Material Theme support
- Inlcuding 20+ Intellij and 20+ Material Themes builtin
- Scaling font size in settings increases code size and all font sizes throughout the UI
- Jetbrains Mono is now bundled as the default Font for development
Notice Also
- The menu bar is now integrated with the title on platforms with that enabled (Windows 10/11)
- File chooser now includes shortcuts to popular locations
- Native window decorations on Windows 10 – Snapping / Shadows / etc.
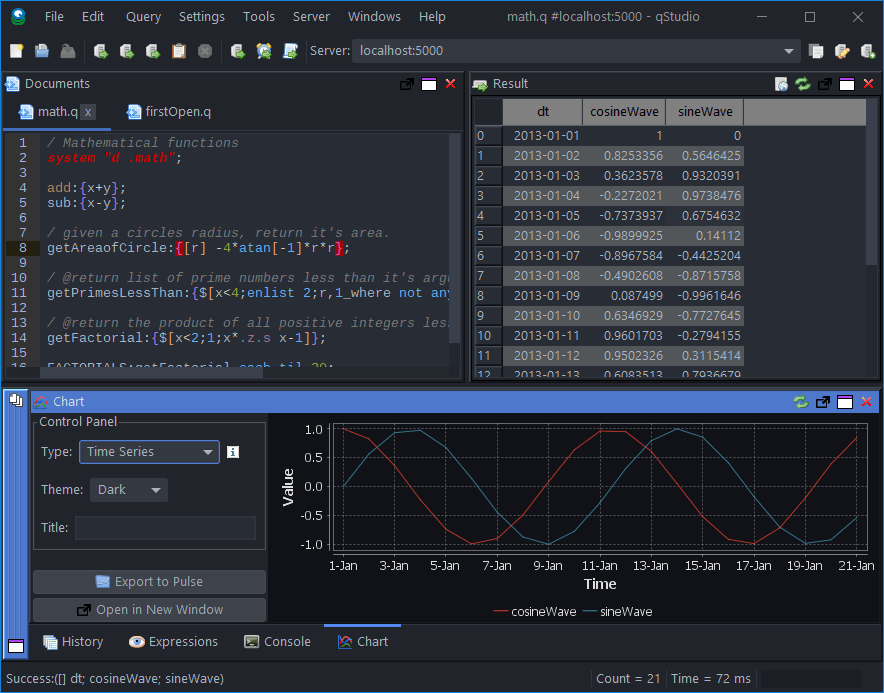
qStudio Dark Theme
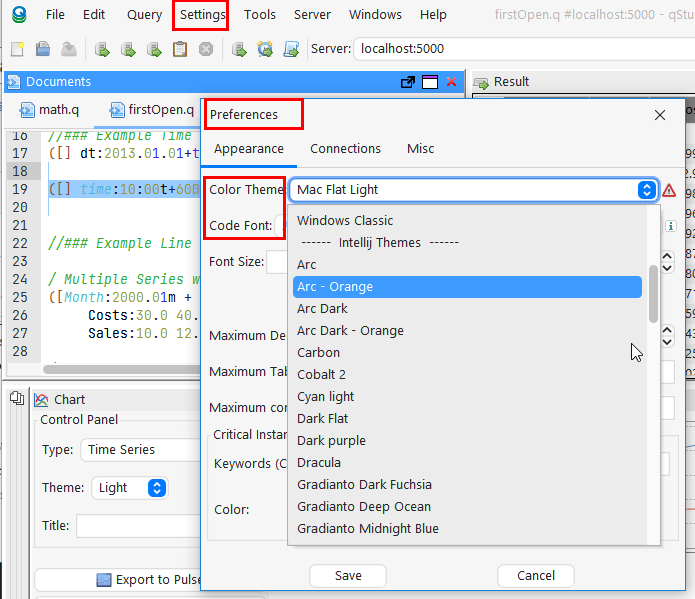
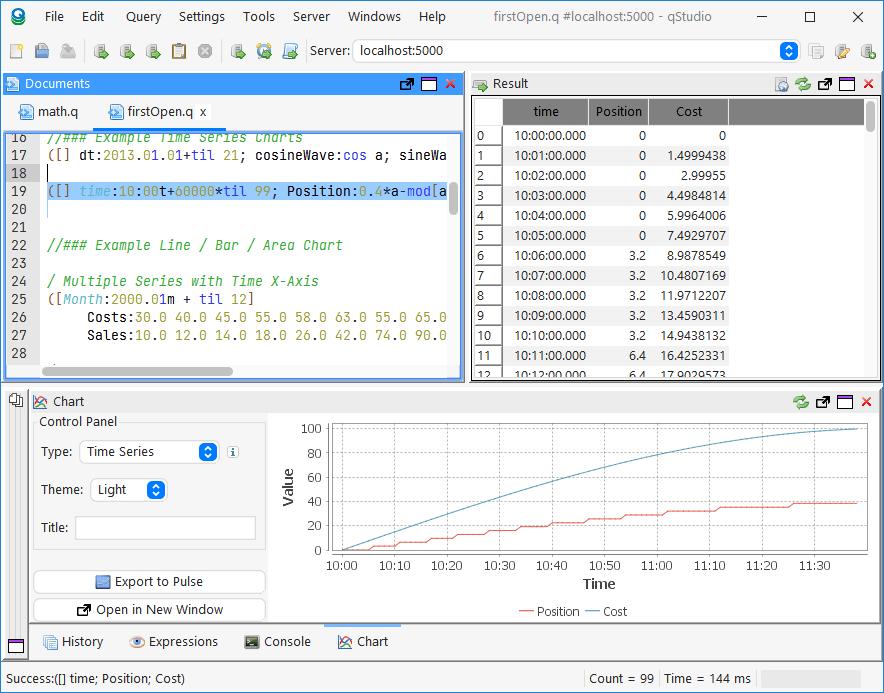
qStudio Light Mac Theme
March 24th, 2023 by John Dempster
Linked Tables and Charts
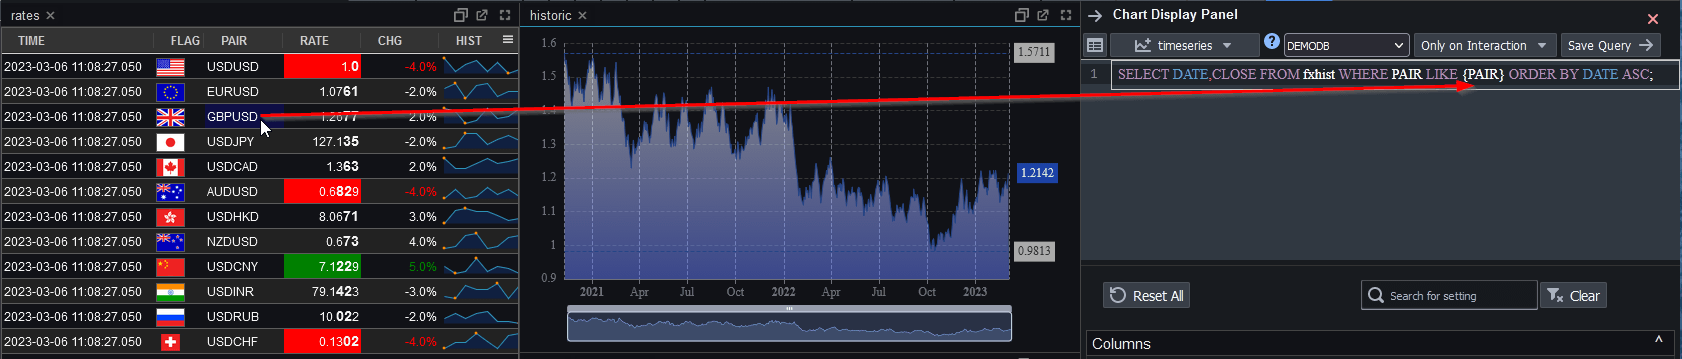
Since our last blogged release our biggest new feature is Linked Tables and Charts.
When a user clicks on a table or chart, it populates variables that can be used within other charts and tables.
One very creative user already used this to create tableA that when clicked populates tableB, that when click populates tableC and so on 4 levels deep.
Click the image below to see details and to find a tutorial video.
Stability
With increasing users comes more edge cases that are hard to predict in advance. We’ve invested a lot in stability in the last 2 months, not all of which will be immediately visible. One hotspot involved a number of issues related to websockets including internal firewall rules, cloudflare websocket timeouts and slow subscribers. One of the more interesting changes was introducing a heartbeat on the websocket to prevent timeouts, we then reused that heartbeat to detect slow subscribers for example when someone moves a tab to the background or minimizes their browser. We now smartly throttle back their querying until they catch up or bring the browser back to being visibile. We’ve addressed all known issues and added a number of stress testing test runs to ensure they always continue to work in future.
REST API
Lastly, some of our advanced kdb users spin up dynamic processes for users. They wanted to make those servers available in Pulse.
We’ve added a REST API to allow setting servers dynamically using a API keys.
January 23rd, 2023 by John Dempster
It’s a New Year, traditionally the time to consider a potential job change.
To help your search we have:
November 29th, 2022 by John Dempster
A massive thanks for those that got in touch last month to wish us well on our new product launch. It has been exciting seeing the uptake and receiving user feedback. A particularly big thanks to JP/VS/JC/IL and MC.
Based on user requests, the largest developments since last month have been:
- Security integration – to allow firm wide rollout. We now support both Apache proxies and kdb based authentication.
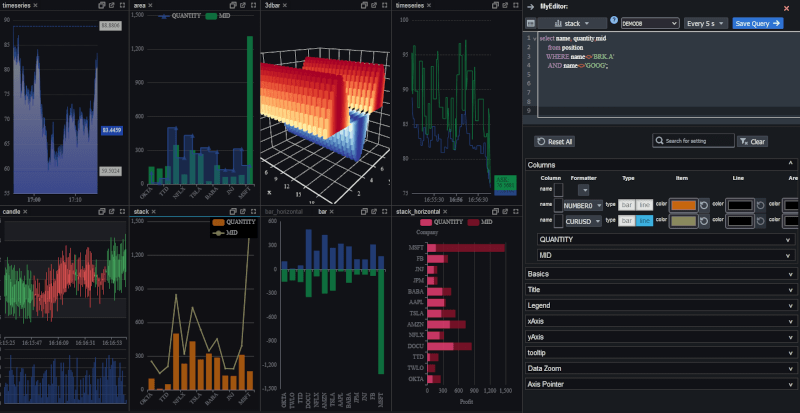
- Chart Customization – Configuration of 100+ chart attributes from the UI.
- Improved PostgreSQL support – Expanded query support and updated drivers.
If you need fast visualization or tableau is proving too slow, this is your chance to get in early and help steer development to solve your problem.
Contact us, if you have any feedback or need assistance with configuration.
Issues can be posted to github and source is available for customers.

Pulse – kdb+ Streaming Subscriptions
Pulse – example customization
November 29th, 2022 by John Dempster

// Real-time kdb+ data visualization
Pulse is a tool that allows you to create and share real-time interactive dashboards with your team.
It’s been almost ten years since the launch of qStudio and our original sqlDashboards.
We have seen the need for fast real-time interactive dashboards increase.
Quants increasingly want to build, deploy and roll out visualizations faster and more reliably.
As such we are excited to annnounce Pulse, an HTML5/react based solution that allows you to build a dashboards based on kdb+ or postgresql or mysql data.
It’s early days and the product is under heavy development:
- New features will be released at least monthly
- We expect to offer a 1 year license for £199
- A free 50-day trial version can be downloaded at timestored.com/pulse
If you have a need for fast visualizations that you haven’t solved or tableau is proving too slow, this is your chance to get in early and help steer development to solve your problem.
November 5th, 2015 by John Dempster
Previously on our blog we had a lively debate about a possibly Open Sourced kdb+ , unfortunately kx now seems to be moving the opposite direction. In a recent announcement they are now restricting “32-bit kdb+ for non-commercial use only”. The timing is particularly unfortunate as:
Alternative (far less enterprise proven) solutions are available:
- MAN AHL have released Arctic an open source Market Data platform based on python and MongoDB
- Kerf Database – A DB aimed at the same market as kdb has now partnered with Briarcliff-Hall and is making greater sales inroads
This renewed interest in kdb alternatives hasn’t so far delivered a kdb+ killer but I fear in time it will.
March 4th, 2014 by John Dempster
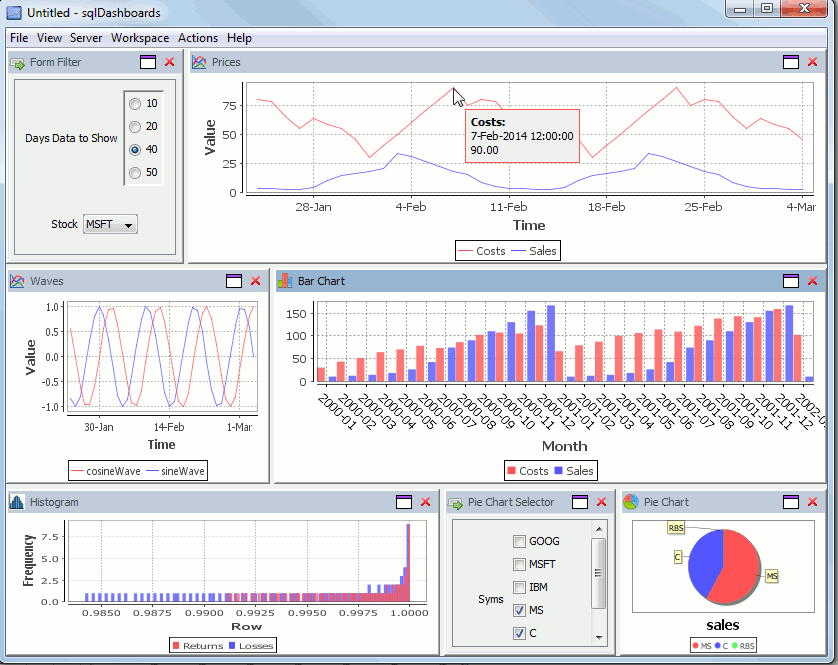
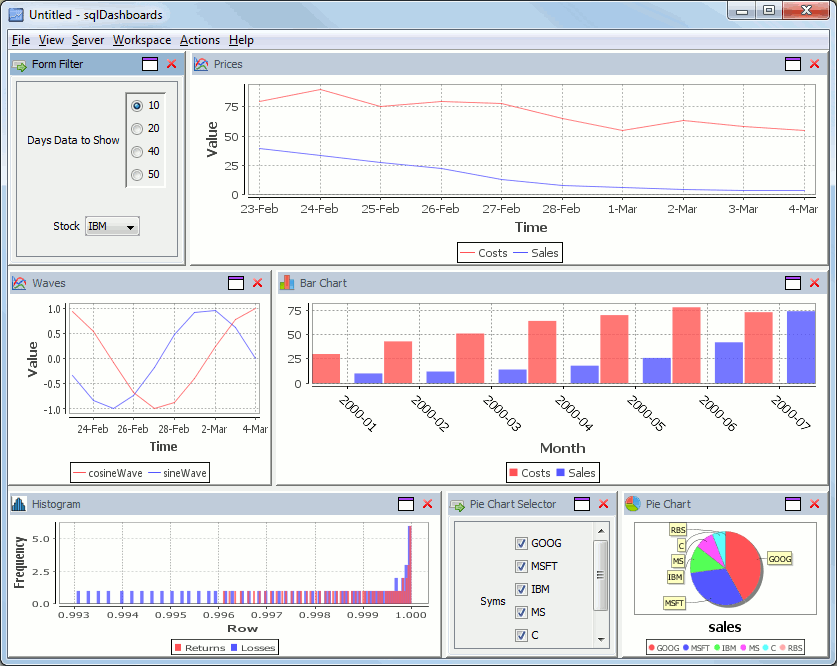
sqlDashboards is a tool for creating real-time sql based charts.
The latest 1.31 release is available to download.
Our new “Forms” now make the charts interactive. here’s an example dashboard showing some stock data, notice the form in the top left allowing selecting a stock ticker and the number of days data to show. On the bottom right is another form containing checkboxes for each country. We can change these selections and the charts will be updated instantly.
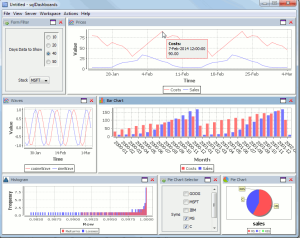
Now I modify my selection to ask for more days data, and untick some country checkboxes, to alter which ones are shown in the pie chart, the charts update straight away to give this:
Full details on how to create forms can be found in the sqlDashboards help.
If you use kdb see our “help menu”->Open example kdb dashboard option.
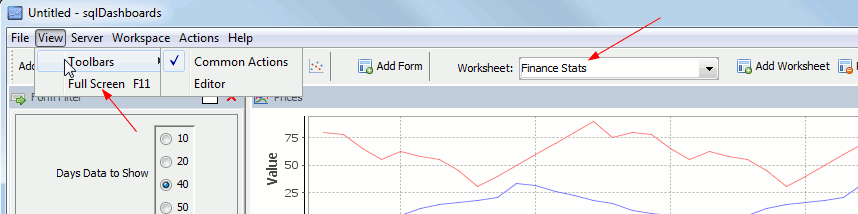
Multiple worksheets and Full Screen
Customers had asked us for to allow multiple worksheets, it’s now been added. As well as a new Full Screen mode to maximise display use when not editing the dashboard, the options can be found here:
We are going to continue to add new functionality…increasingly configurable charts, command line chart generation, web interfaces…if you have any features you would like added please get in touch, we are always happy to receive feedback.