QStudio Help
Getting Started
If you installed QStudio for windows you can start it from the start menu, on linux/macs you should be able to make the jar executable and run it as long as you have java 1.6+ installed. (Click here for detailed instructions)
Connecting to a Server
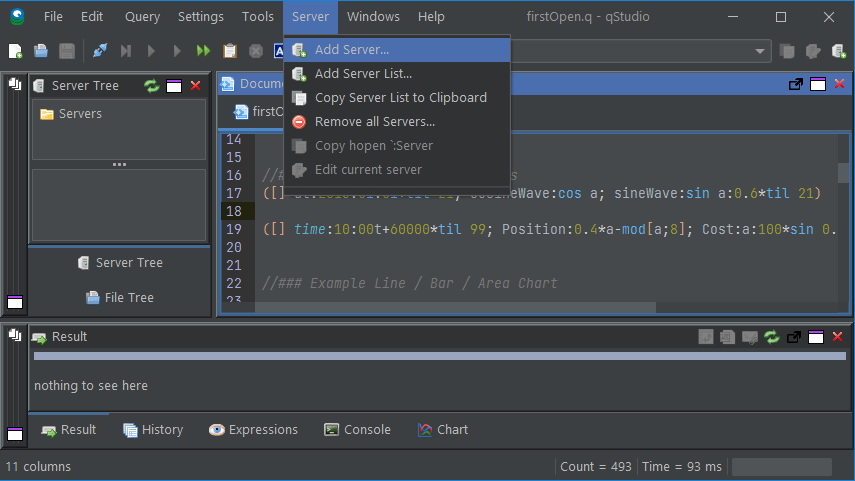
When you first open QStudio it will look like the image below.
- Click on the menu options
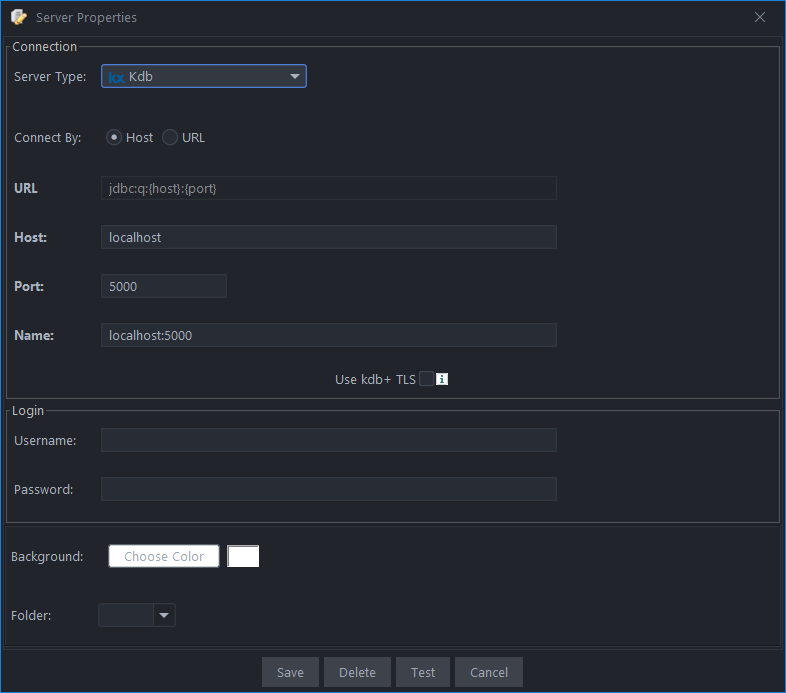
Server->Add Serveror on the add server button on the toolbar. - Enter the server details and click add
Sending Queries
Now that you have added a server the panel labeled Server Tree will now display a nested drop down list of all tables / variables that exist on the server. On the toolbar the selected server dropdown will automatically have selected the latest added server. To send a query:
- Within the Documents panel click the cursor on the line with q code you want to execute.
Example:([] dt:2013.01.01+til 21; cosineWave:cos a; sineWave:sin a:0.6*til 21) - Press Control+Enter to execute that line
- Or particularly useful for multi-line queries, highlight the text you want to execute and press Control+e to execute it.
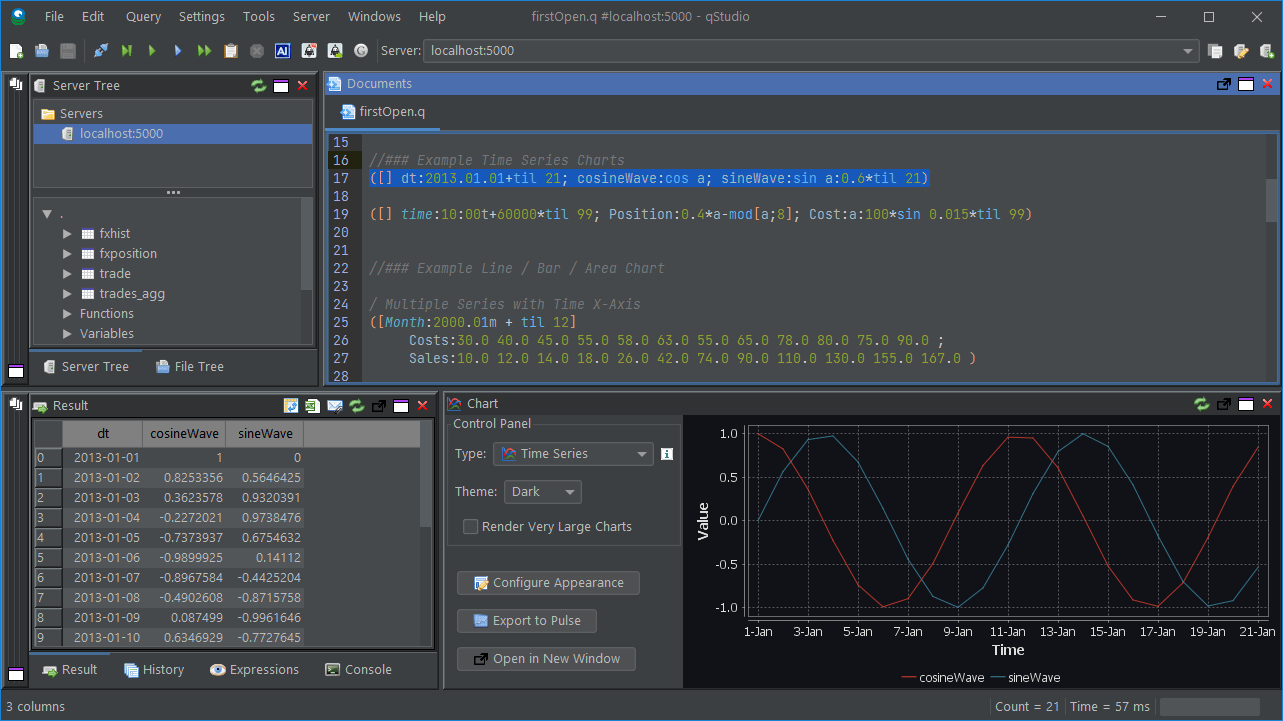
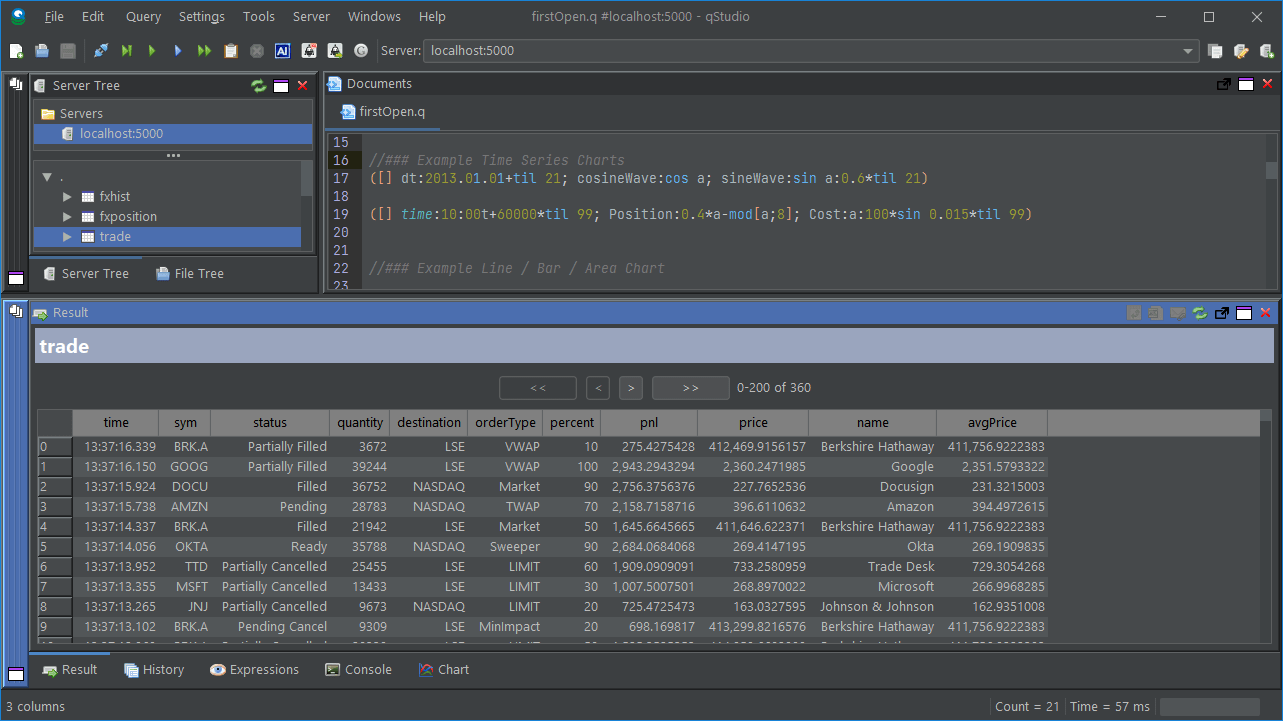
Here you can see that I have sent the highlighted query. The result panel displays query results in the most appropriate format possible which for this data is as a table. If we click on the chart panel you will see that it has plotted a time series graph.
The Server Tree
When you added your kdb server the panel labeled Server Tree should have filled with the variables that exist on that server. e.g.
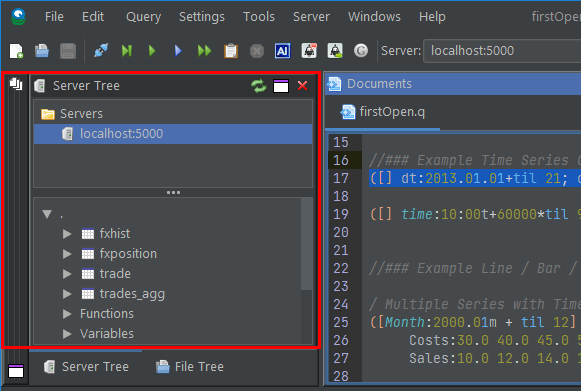
You can see that because I hovered it gave me some details about that variable. You can also Click on items to display them in the result panel. Here I have clicked on the quote item and I can page through that table in the result panel.
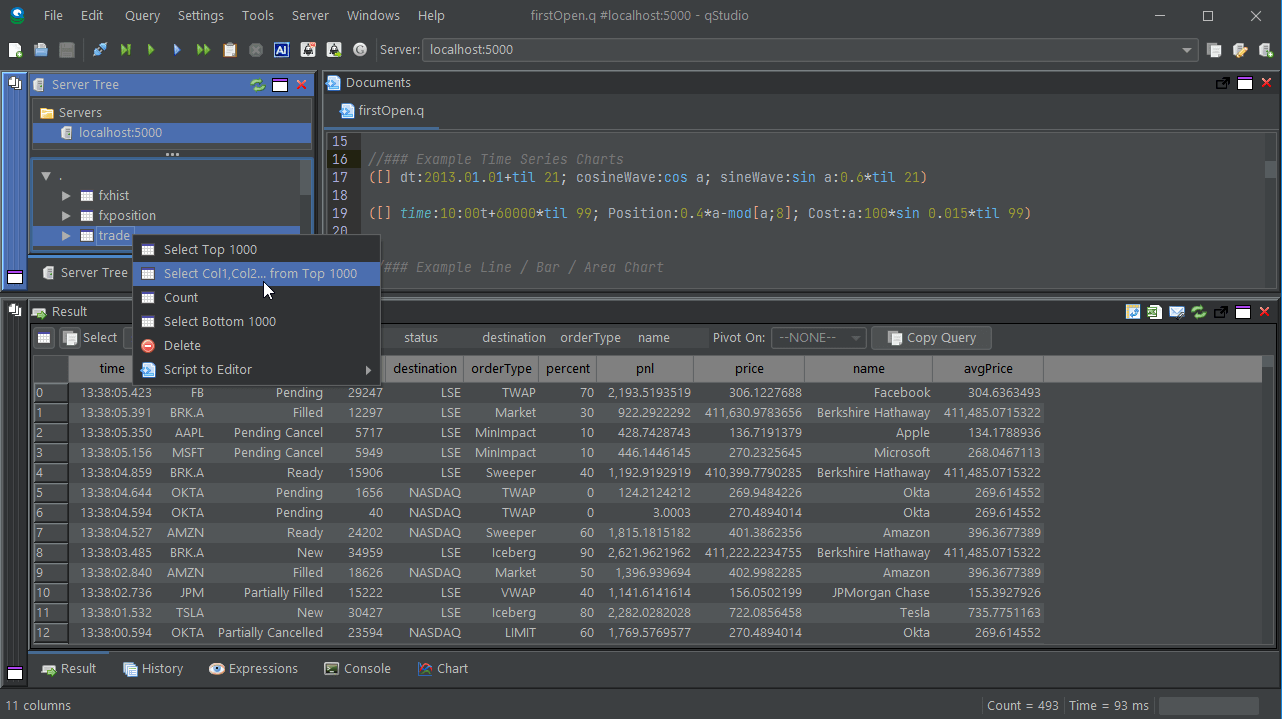
Right click can also be used to bring up actions relevant to that item.
- Next Topic: Creating Charts
- Index