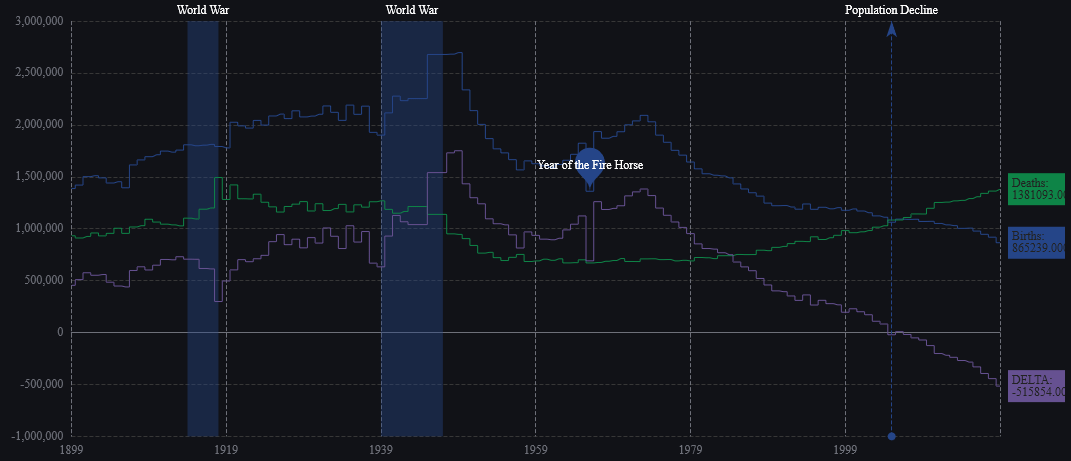
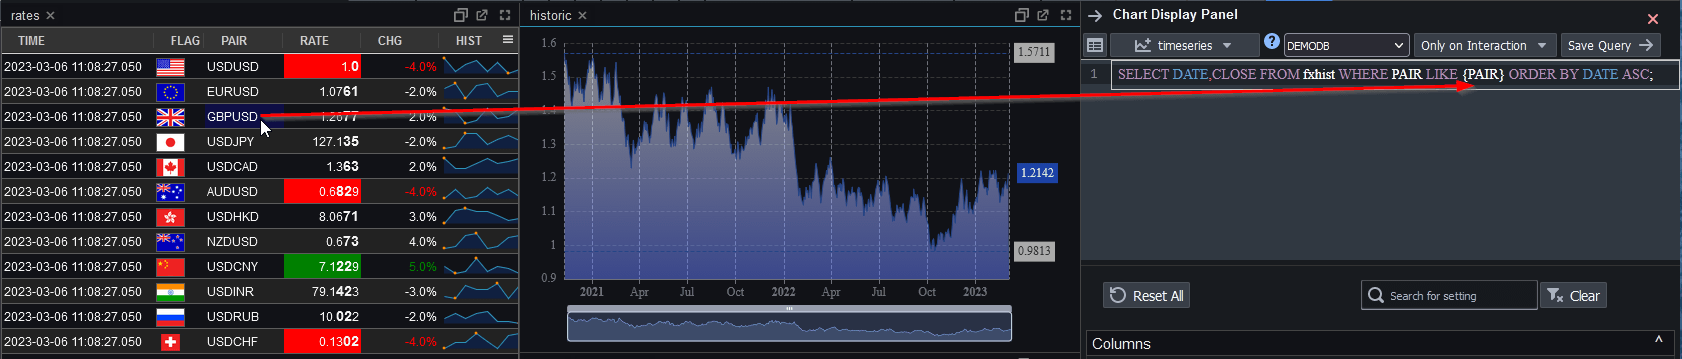
We have been working on version 2.0 of Pulse with a select group of advance users for weeks now. To give you a preview of one new feature, check out markers shown on the chart below. We have marker points, lines and areas.For example this will allow adding a news event to a line showing a stock price. This together with many other changes should be released soon as part of 2.0.
Pulse is specialized for real-time interactive data, as such it needs to be fast, very fast. When we first started building Pulse, we benchmarked all the grid components we could find and found that slick grid was just awesome, 60East did a fantastic writeup on how Slick grid compares to others. As we have added more features, e.g. column formatting, row formatting, sparklines…..it’s important to constantly monitor and test performance. We have:
Automated tests that check the visual output is correct.
Throughput tests to check we can process data fast enough
Manual tests to ensure subtle human interactions work.
Memory leak checks as our dashboards can be very long running.
Today I wanted to highlight how our throughput tests work by looking at our grid component.
HTML Table Throughput Testing
To test throughput we:
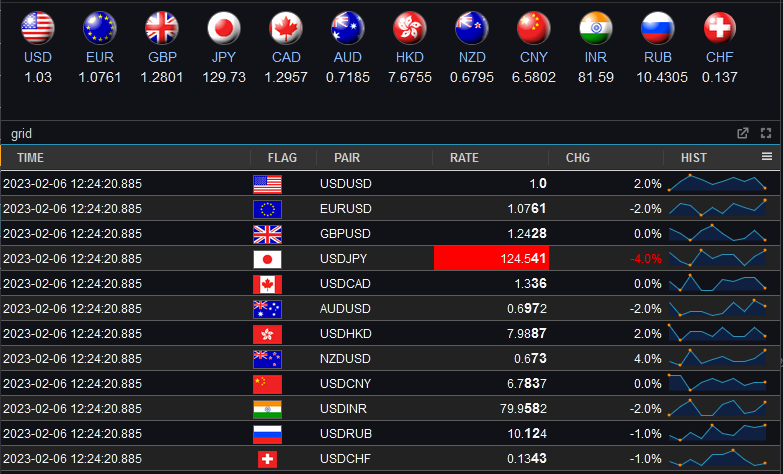
Use scenarios as close to our customers typical use cases as possible.
The most common query being a medium sized scrolling trade blotters with numerical/date formatting and row highlighting.
200 rows of data, scrolling 50 rows each update.
We use a subscription connection to replay and render 1000s of data points as fast as possible.
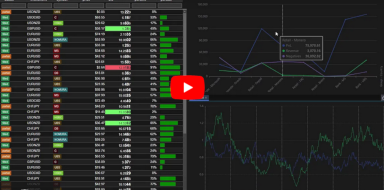
Video Demonstrating 21,781 rows being replayed as 435 snapshots taking 16 seconds = 27 Updates per second. (European TV updates at 25 FPS).
Update: After this video we continued making improvements and with a few days more work got to 40 FPS.
Profiling Slick Grid Table
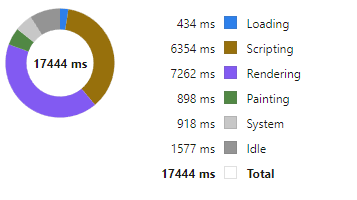
Breakdown
We then examine in detail where time is being spent. For example we:
Turn on/off all formatting, all rendering options.
Add/Remove columns
Change screen sizes
Change whether edit mode is on or table cells have been select (Off fact: selecting a cell makes the grid 30% slower to update)
Then we try to improve it!
Often this is looking at micro optimizations such as reducing the number of objects created. For example the analysis of how to format columns is only performed when columns change not when data is updated with the same schema. The really large wins tend to be optimizing for specific scenarios, e.g. a lot of our data is timestamped and received mostly in order. But those optimization are for a later post.
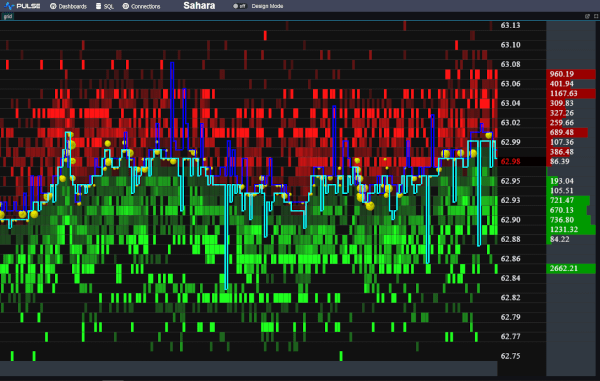
We want to be the best finance streaming visualization solution. To achieve that, we can’t just use off the shelf parts, we have built our own market data order book visualization component from scratch, it’s only dependency is webgl. We call it DepthMap. It plots price levels over time, with the shading being the amount of liquidity at that level. It’s experimental right now but we are already receiving a lot of great feedback and ideas.
Faster Streaming Data
A lot of our users were capturing crypto data to a database, then polling that database. We want to remove that step so Pulse is faster and simpler. The first step is releasing our Binance Streaming Connection. In addition to our existing kdb streaming connection, we are trialling Websockets and Kafka. If this is something that interests you , please get in touch.
Our latest product Pulse is for displaying real-time interactive data direct from any database. To get most benefit, the underlying databases need to be fast (<200ms queries). For our purposes databases fall into 2 categories:
Really really fast, can handle queries every 200ms or less and seamlessly show data scrolling in
All Other Databases. The 95%+.
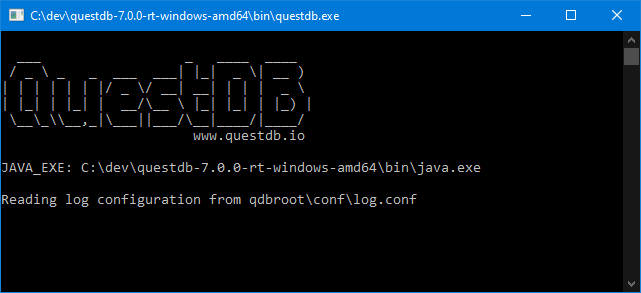
It’s very exciting when we find a new database that meets that speed requirement. I went to the website, downloaded QuestDB and ran it. Coming from kdb+ imagine my excitement at seeing this UI:
Good News:
A very tiny download (7MB .jar file)
There’s a free open source version
They are focussed on time-series queries
Did I mention it’s fast
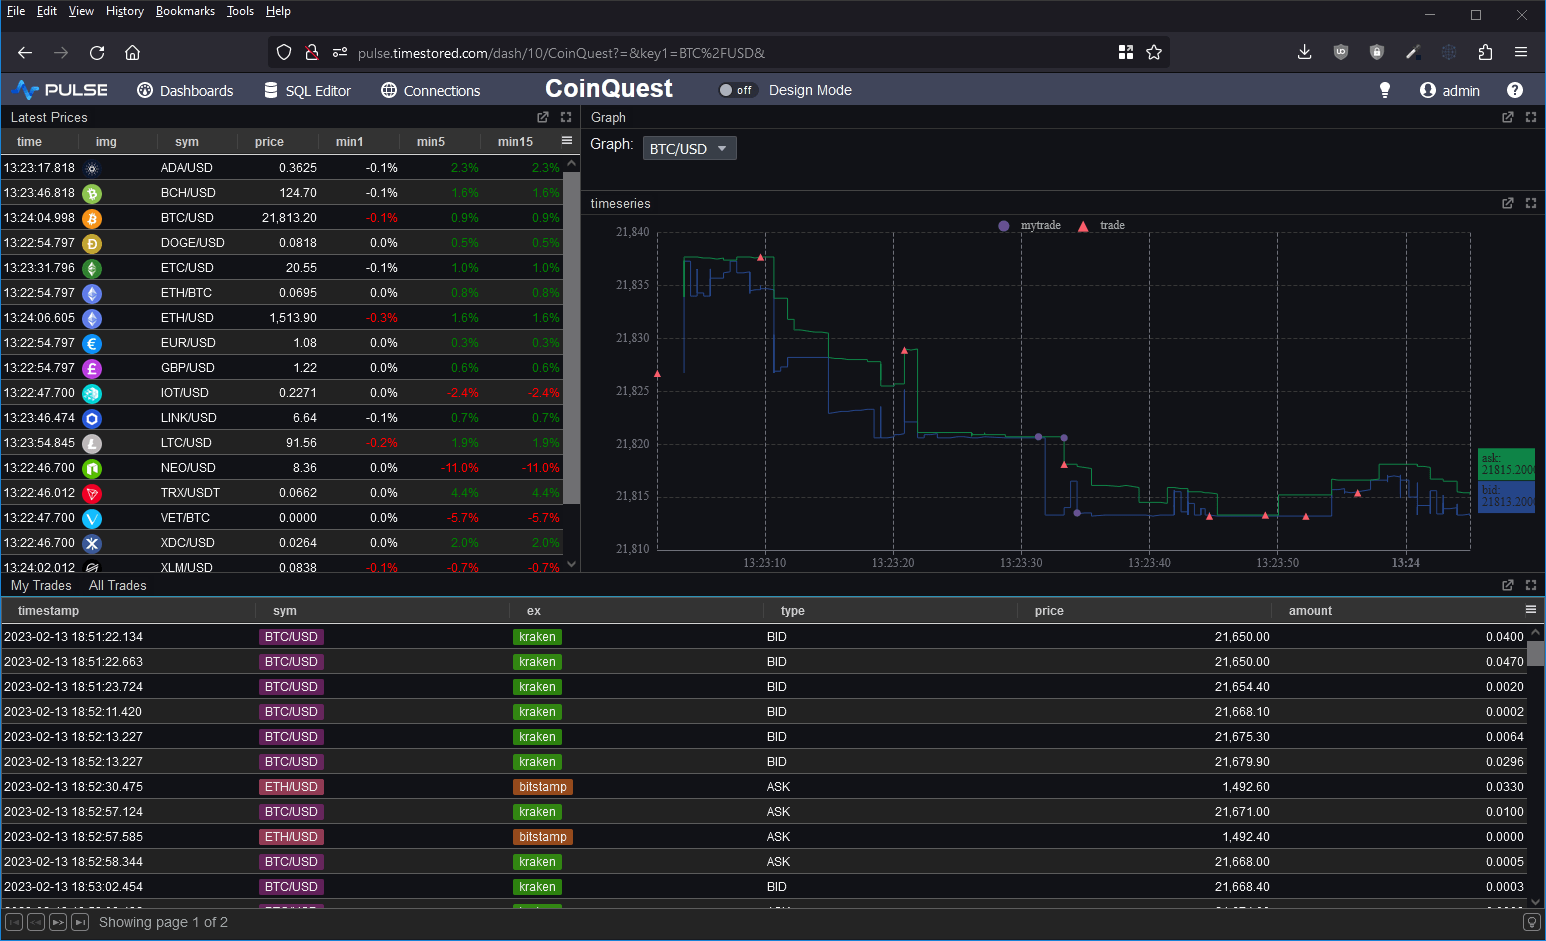
I wanted to take it for a spin and to test the full ingestion->store->query cycle. So I decided to prototype a crypto dashboard. Consume data from various exchanges and produce a dashboard of latest prices, trades and a nice bid/ask graph as shown below.
Good Points
It simply worked.
QuestDB chose to be PostgreSQL wire and query compatible. A great technical choice as:
It will work with many tools including Pulse without complication
Many people already know SQL. I’ve been teaching q/kdb for years and when people learn it, you can use it for absolutely amazing things that standard SQL is terrible at. However most people do not reach that level of expertise. By using standard SQL more people can reuse their existing knowledge.
They then added Time-series specific extensions ontop for querying, including:
“Latest on” – that’s equivalent to kdbs “last by”. It’s used to generate the “latest prices” table in the dashboard with a 1/5/15 minute lag.
QuestDB can automatically create tables when you first send data, there’s no need to send “Create Table …”. This was useful when I was tweaking the data layout from the crypto feeds.
At parts my SQL was rusty and I asked for help on their slack channel. Within an hour I got helpful responses to both questions.
Within a very short time, I managed to get the database populated and the dashboard live running. This is the first in a long time that a database has gotten me excited. It seems these guys are trying to solve the same user problems and ideas that I’ve seen everywhere. There were however some significant feature gaps.
Feature Gaps
No nested arrays. If I want to store bid/asks, I can only currently do it with columns bid1/bid2/bid3, no arbitrary length arrays.
Very limited window analytics. Other than “LATEST ON” QuestDB won’t let me perform analysis within that time window or within arrays in general.
I really missed my
`time xasc (uj/)(table1;table2)
pattern for combining multiple tables into one. For the graph I had to use a lengthy SQL UNION.
In general kdb+ has array types and amazingly lets you use all the same functions that work on columns on nested structures. I missed that power.
No security on connections. It seems security integration will be an enterprise feature.
Open Source Alternative to kdb+ ?
Overall I would say not yet but they seem to be aiming at a similar market and they are moving fast.
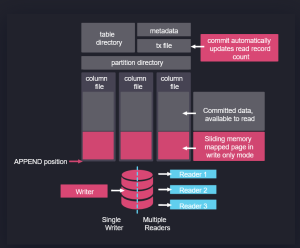
In fact, if you look at their architecture on the right, it’s obvious some of their team have used kdb+. Data is partitioned on date, with a separate folder per table and a column per file. Data is mapped in when read and appended when new data arrives.
In some ways this architecture predates kdb+ and originates from APL. It’s good to see new entrants like QuestDB and apache arrow pick up these ideas, make them their own and take them to new heights. I think kdb+ and q are excellent, I was always frustrated that it has remained niche while inferior technical solutions became massively popular, if QuestDB can take time-series databases and good technical ideas to new audiences, I wish them the best of luck!
Please leave any of your thoughts or comments below as I would love to hear what others think.
If you want to see how to setup QuestDB and a crypto dashboard yourself, we have a video tutorial:
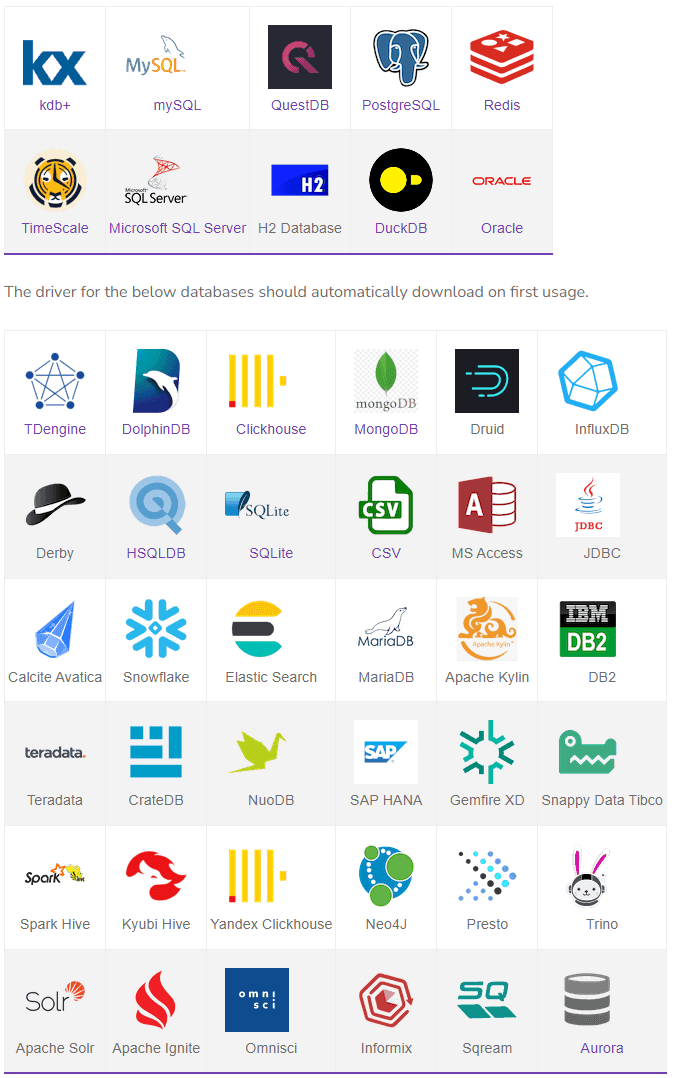
Pulseis being used successfully to deliver data apps including TCA, algo controls, trade blotters and various other financial analytics. Our users wanted to see all of their data in one place without the cost of duplication. Today we released support for 30+ databases.
“My market data travels over ZeroMQ, is cached in Reddit and stored into QuestDB. While static security data is in SQL server. With this change to Pulse I can view all my data easily in one place.” – Mark – Platform Lead at Crypto Algo Trading Firm.
// Highlighted Partners
In particular we have worked closely with chosen vendors to ensure compatibility.
A number of vendors have tested the system and documented setup on their own websites:
TDEngine – Open-source time series database purpose-built for the IoT (Internet of Things).
QuestDB – Open source time-series database with a similar architecture to kdb+ that supports last-by and asof joins. See our crypto Pulse demo.
TimeScale – PostgreSQL++ for time series and events, engineered for speed.
ClickHouse and DuckDB – Were tested by members of their community and a number of improvements made.
Over the last few months, I’ve discussed grid components, aggregating and pivoting with a lot of people. You would not believe how much users want to see a good grid component that allows drill down and how strongly they hold opinions on certain solutions. I have examined a lot of existing solutions, everything from excel, to powerBI, Oracle, DuckDB, hypertree, grafana, tableau……. I think I’m beginning to converge these ideas and requests into a pivot table that will be a good solution for our users:
Like all of our work, it should be really really fast
It must work with Big Data
It should be Friendly
It must allow changing aggregations – e.g. Group by exchange OR group by exchange and sym
Allow pivoting some calculations – from one column to a breakdown in separate columns
It must work for all databases.
Well now the proposed interface looks like this:
Pulse - Pivot
A lot of the functionality inspiration should be credited to Stevan Apter and HyperTree. Ryan had seen HyperTree and loved the functionality and beautiful kdb only implementation. The challenge was to allow similar functionality for all databases while making it more accessible. We now have a working demo version.
If you love pivot tables and have never got to see your dream grid component come to fruition, we want to build it, so get in touch.
Are you a Quant or kdb Developer struggling to get the UI team to work on your app?
With Pulse, you can now build interactive data tools fast by yourself.
Pulse version 1.0 is available to download now and allows you to build real-time interactive data apps, free for up to 3 users.
After an intense year working closely with groups of quants and data analysts, with releases every week, Pulse has reached a major milestone. Pulse 1.0 is being used successfully to deliver data apps including:
Event handlers allowing you to trigger queries, and perform other actions in response to user interactions.
A massive thanks to the many beta testers, early adopters, users and companies that invested in and purchased Pulse.
Particular thanks to Rahul, Ruairi, Ian, Steve, Chris, WooiKent, Franco, Palmit, JP, JD, PN, SG, JM, KF, AR, MC, JC, CA, SS. Thanks for raising numerous feature requests and providing excellent feedback that helped make Pulse what it is today.
Since our last blogged release our biggest new feature is Linked Tables and Charts.
When a user clicks on a table or chart, it populates variables that can be used within other charts and tables.
One very creative user already used this to create tableA that when clicked populates tableB, that when click populates tableC and so on 4 levels deep.
Click the image below to see details and to find a tutorial video.
Stability
With increasing users comes more edge cases that are hard to predict in advance. We’ve invested a lot in stability in the last 2 months, not all of which will be immediately visible. One hotspot involved a number of issues related to websockets including internal firewall rules, cloudflare websocket timeouts and slow subscribers. One of the more interesting changes was introducing a heartbeat on the websocket to prevent timeouts, we then reused that heartbeat to detect slow subscribers for example when someone moves a tab to the background or minimizes their browser. We now smartly throttle back their querying until they catch up or bring the browser back to being visibile. We’ve addressed all known issues and added a number of stress testing test runs to ensure they always continue to work in future.
REST API
Lastly, some of our advanced kdb users spin up dynamic processes for users. They wanted to make those servers available in Pulse.
We’ve added a REST API to allow setting servers dynamically using a API keys.
Pulse is designed to provide real-time interactive dashboards so the underlying database has to be really fast. Pulse can support almost any data source, the question is which databases are worth supporting.
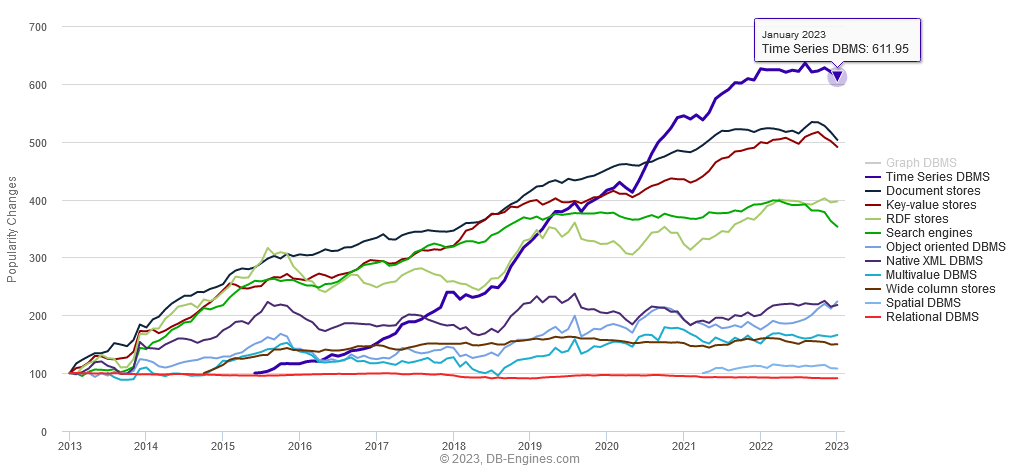
Time-series databases are the fastest growing database sector (image below).
The great news is that in the last few years there has been a a lot of interesting new entrants. So we’ve updated our past articles:
Top Column-Oriented Databases – DuckDB, Clickhouse and Doris are the new exciting entrants. Benchmark results in article.
Top Time-Series Databases – Have exploded in popularity. QuestDB and TimeScale are the new entrants there. Benchmark results in article.