DolphinDB & TimeStored: Partnering for Data Visualization in Quantitative Finance
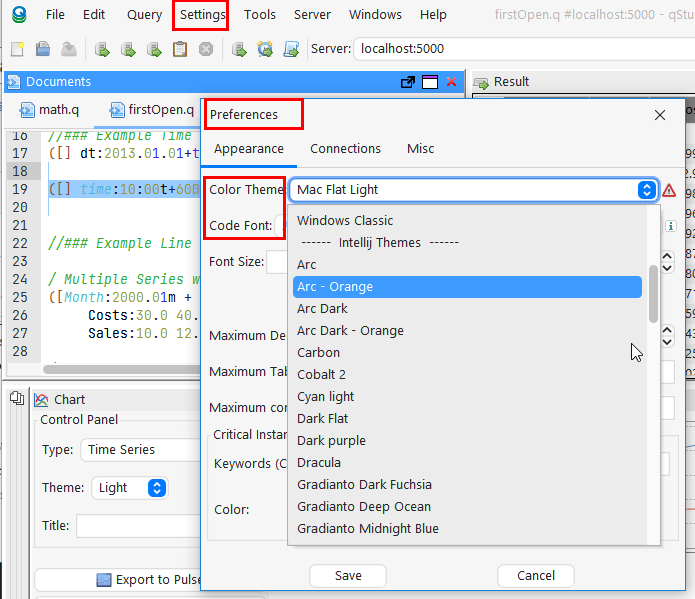
DolphinDB and TimeStored working in partnership. Customization of qStudio can be found here.
Contents below.
DolphinDB, a leading provider of the real-time platform for analytics and stream processing, and TimeStored, a pioneering company in the field of data visualization and analytics, are proud to announce a partnership focused on advancing data visualization in quantitative finance. With an emphasis on integrating DolphinDB’s capabilities into TimeStored’s flagship products, qStudio and Pulse, this partnership aims to deliver innovative enhancements to complex analysis scenarios including quantitative trading, high-frequency backtesting, and risk management.
In the competitive field of quantitative trading, a high level of precision in data analysis is essential. Rivals are constantly striving to boost productivity and efficiency to obtain a competitive edge in the dynamic financial markets. To meet this challenge, DolphinDB is committed to providing cutting-edge real-time analytics tools to people worldwide. It offers a unified platform with over 1500 built-in features and a collection of stream computing engines for data warehouse, analytics, and streaming applications. Because of its exceptional efficiency in investment research, DolphinDB has emerged as a significant technology pillar in key areas including strategic research, risk control, and measurement platforms.
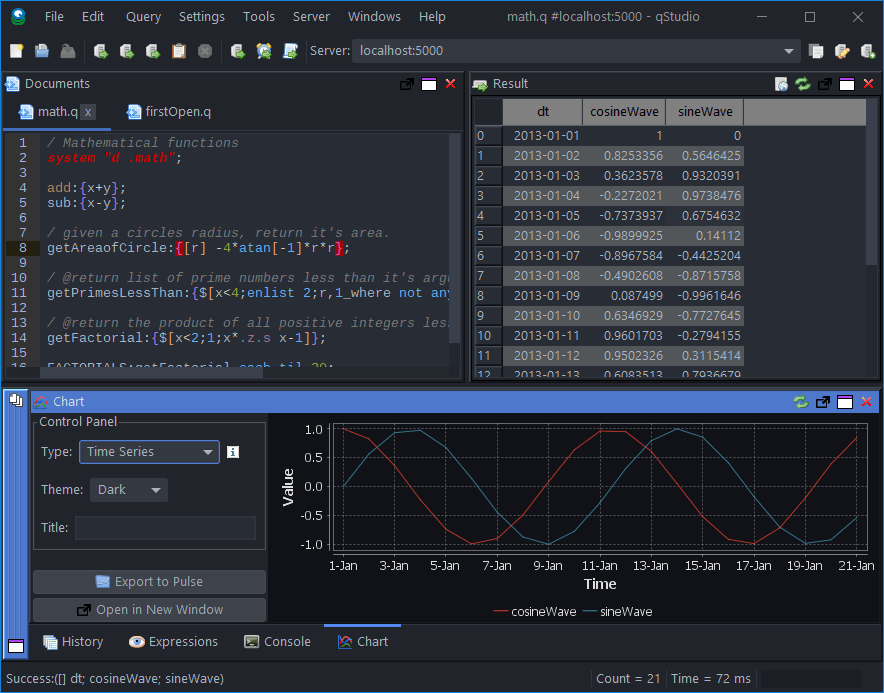
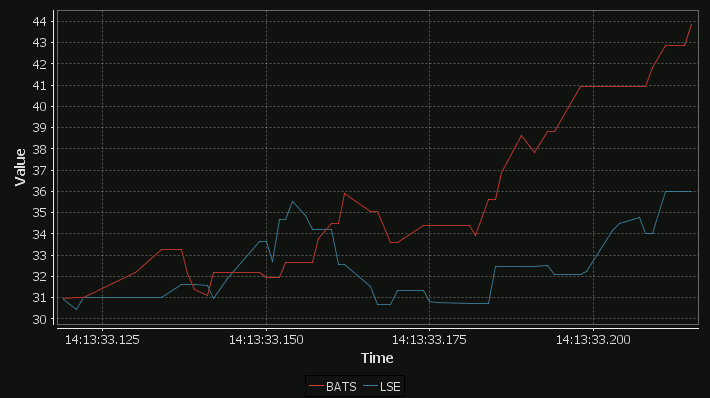
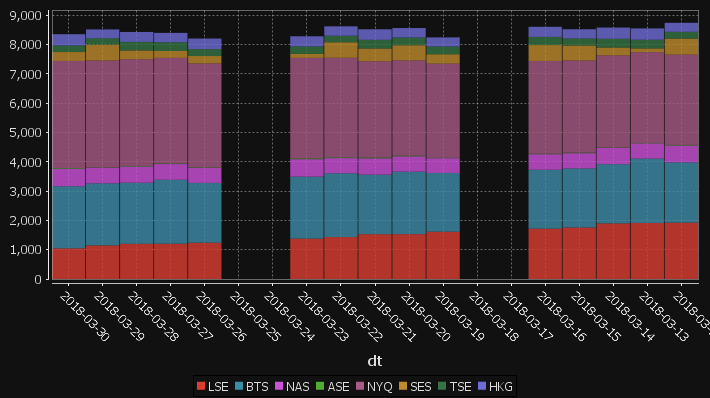
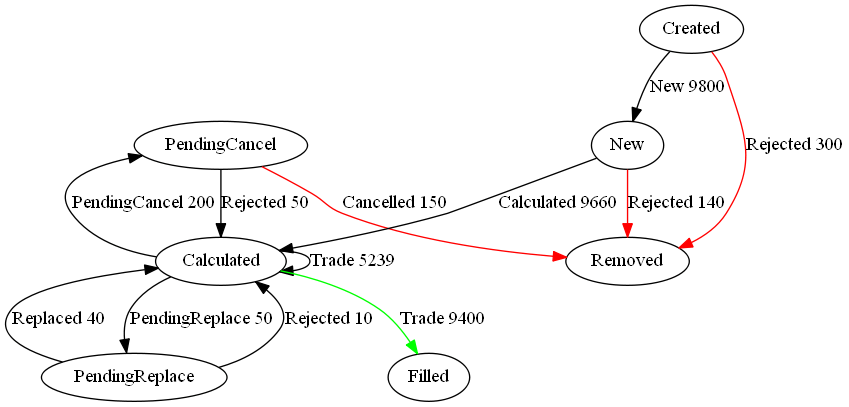
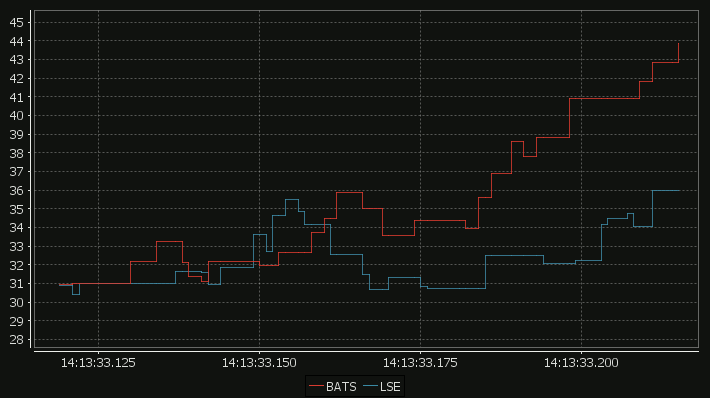
Data visualization is intrinsically intertwined with data analysis, serving as an indispensable partner in the exploration of complex datasets and the extraction of valuable insights. By deeply integrating DolphinDB’s efficient investment research capabilities with TimeStored’s advanced visualization technology, we have constructed a scenario which can intuitively display complex financial data. By transforming abstract financial data into intuitive charts and indicators, we significantly enhanced the readability of information and the efficiency of decision-making. It not only meets the current financial market’s demand for data transparency and immediacy but also provides a powerful analysis and decision-support platform for financial professionals. This empowers them to quickly seize opportunities and effectively manage risks in the volatile market.
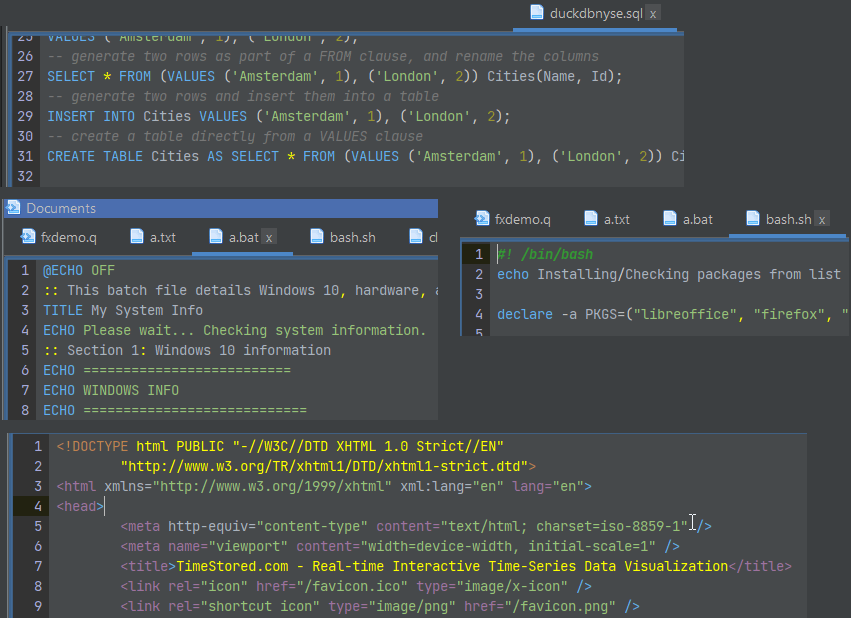
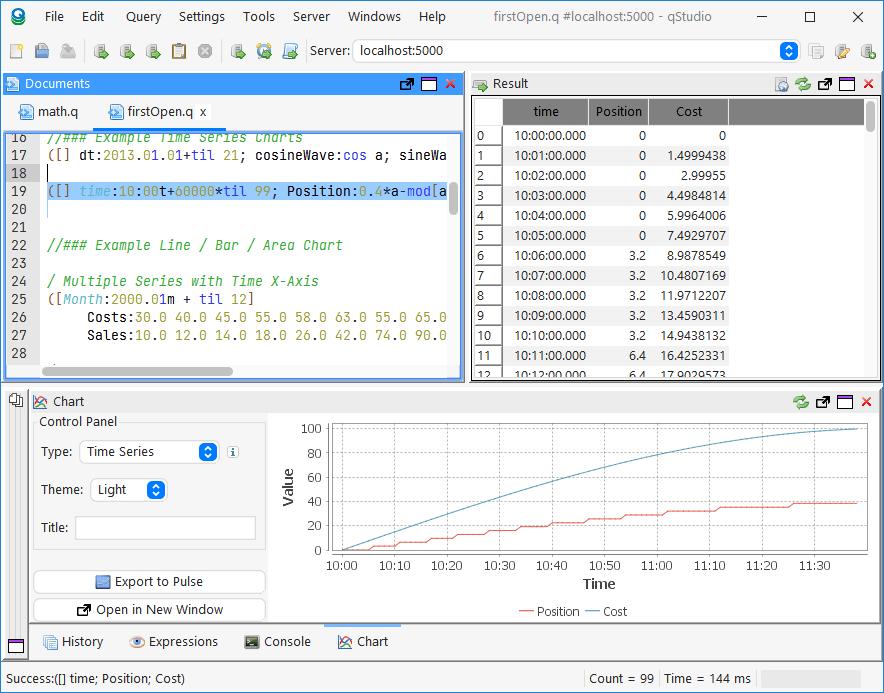
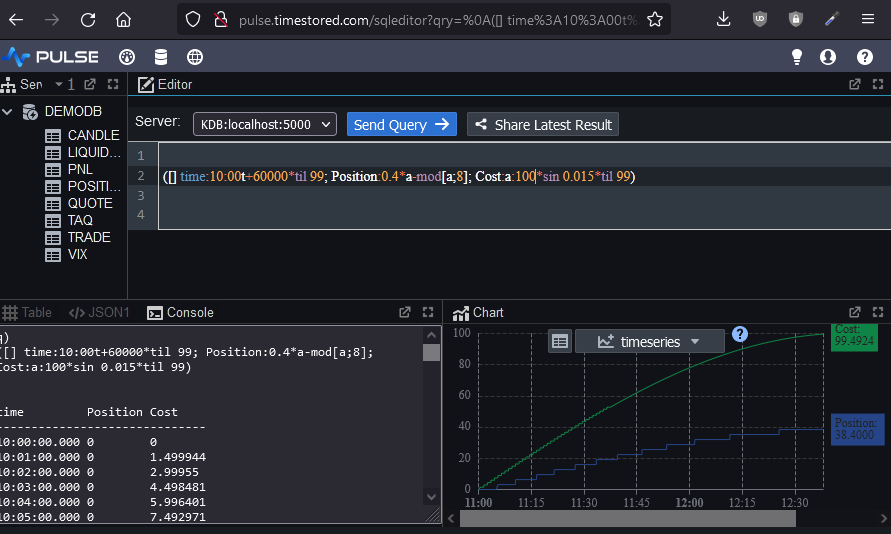
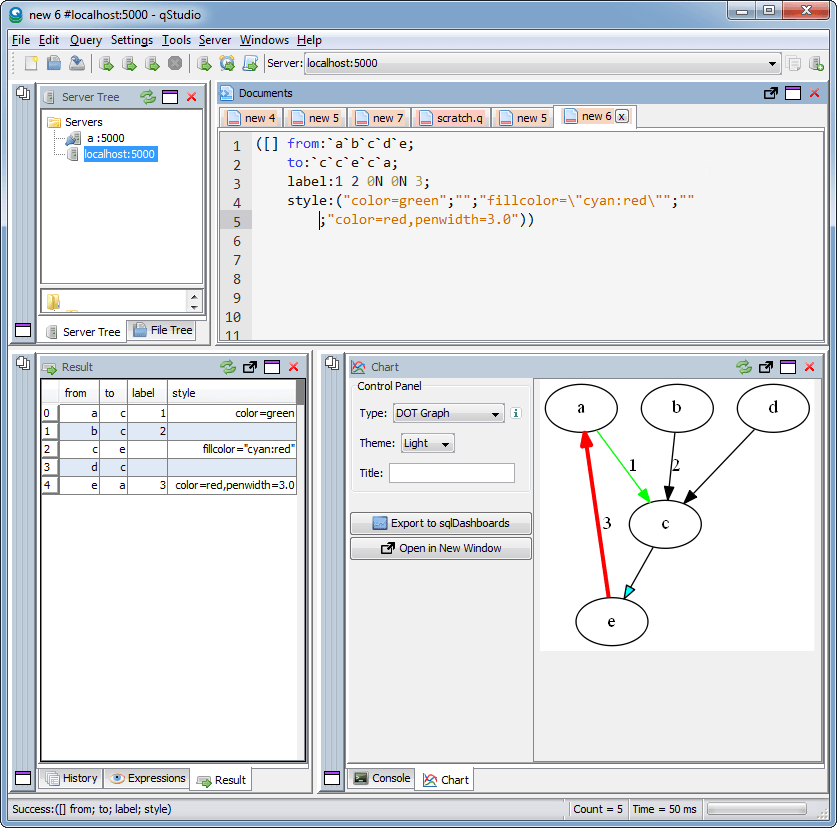
The latest update to qStudio introduces powerful new features: DolphinDB syntax highlighting, code completion, and a server tree view. These enhancements significantly streamline developers’ workflow, offering intuitive coding and improved navigation. Moreover, the partnership has enabled the visualization of DolphinDB data within TimeStored’s Pulse product. It opens up new horizons for users interested in streaming data visualization, enabling a dynamic and interactive approach to analyzing real-time data.
This partnership leverages the technological strengths of both companies to revolutionize data management. DolphinDB and Timestored are committed to delivering the top-tier solutions for data analysis and quantitative investment research experience to global market participants.
About DolphinDB
Founded in 2016, DolphinDB is committed to providing users worldwide with cutting-edge real-time analytics platforms. Our flagship product, DolphinDB, offers a unified platform for data warehouse, analytics, and streaming workloads. At its core, it is a high-performance distributed time-series database. With a fully featured programming language, over 1500 built-in functions, and a suite of stream computing engines, DolphinDB enables rapid development of high-performance applications for mission-critical tasks in global financial institutions.
As an enterprise-focused real-time analytics provider, we take pride in enabling organizations to unlock the value of big data and make smarter decisions through real-time insights into their most demanding analytical workloads.
About TimeStored
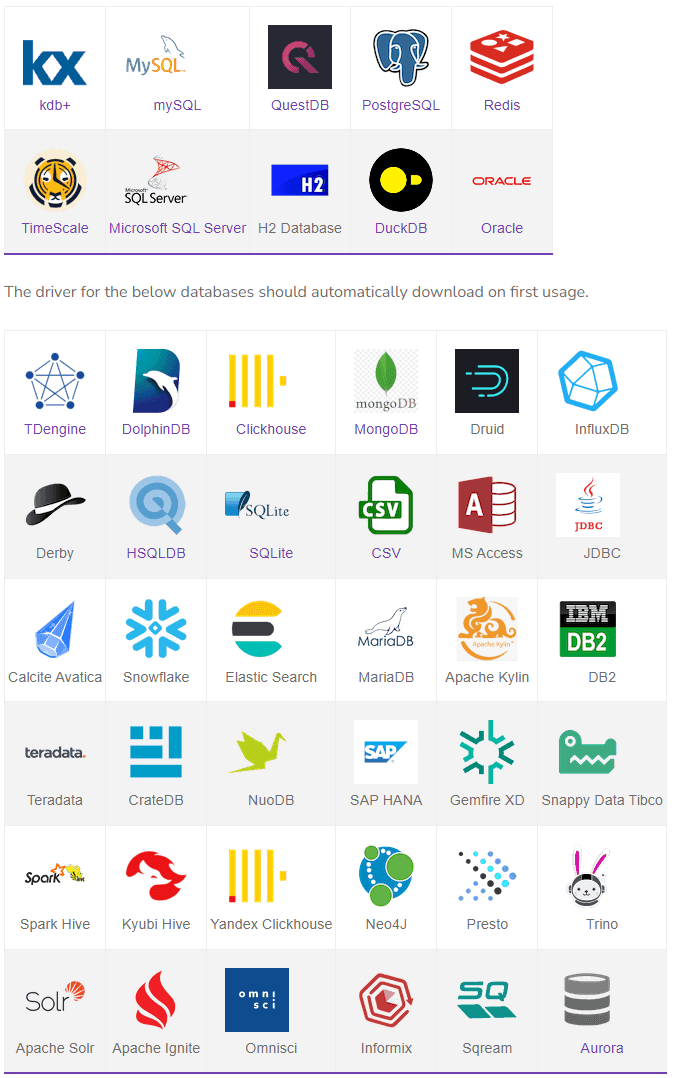
TimeStored specializes in real-time interactive data tools, offering robust solutions since 2013. Their products, like Pulse and qStudio, support a wide array of databases and enhance data analysis capabilities. Pulse enables the creation of real-time interactive dashboards, facilitating collaborative data visualization. qStudio, a free SQL analysis tool, features an intelligent SQL editor with functionalities like syntax highlighting and code completion, aimed at improving the efficiency and effectiveness of data analysts.