QStudio - Time-Series Chart
Time Series
The Time Series chart visualises numeric values that change over time. Each numeric series is plotted as a separate line against a shared time axis and is commonly used for prices, metrics, P&L, volumes, and sensor data.
The chart automatically detects time and numeric columns and supports both wide and long data formats. When safe and unambiguous, long-format data is automatically pivoted into aligned series.
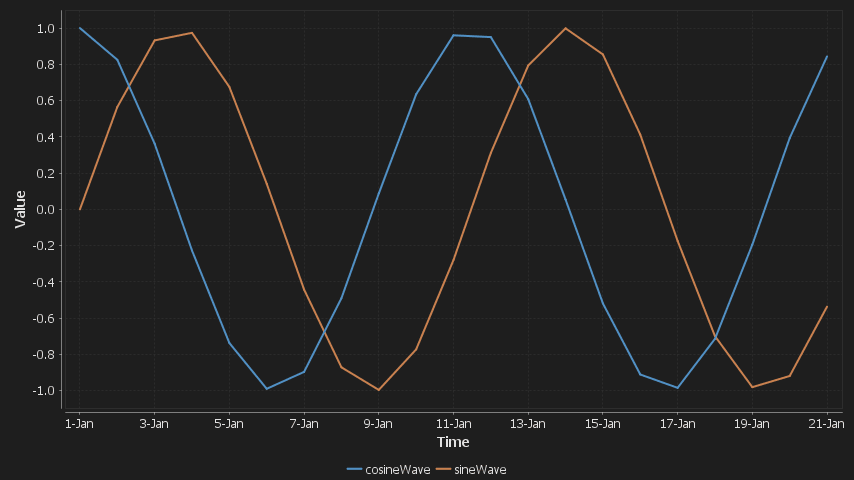
Day Sines
A sine/cosine wave over a period of days.

Supported Data Formats
1. Wide Format (Already Pivoted)
Each row represents a single point in time and each numeric column represents a separate time series.
- The first date or time column found is used for the x-axis.
- Each numeric column becomes one line on the chart.
- No pivoting or reshaping is required.
| dt | seriesA | seriesB |
|---|---|---|
| 2023-01-01 | 10.2 | 12.5 |
| 2023-01-02 | 10.8 | 12.9 |
2. Long Format (Time, Series, Value)
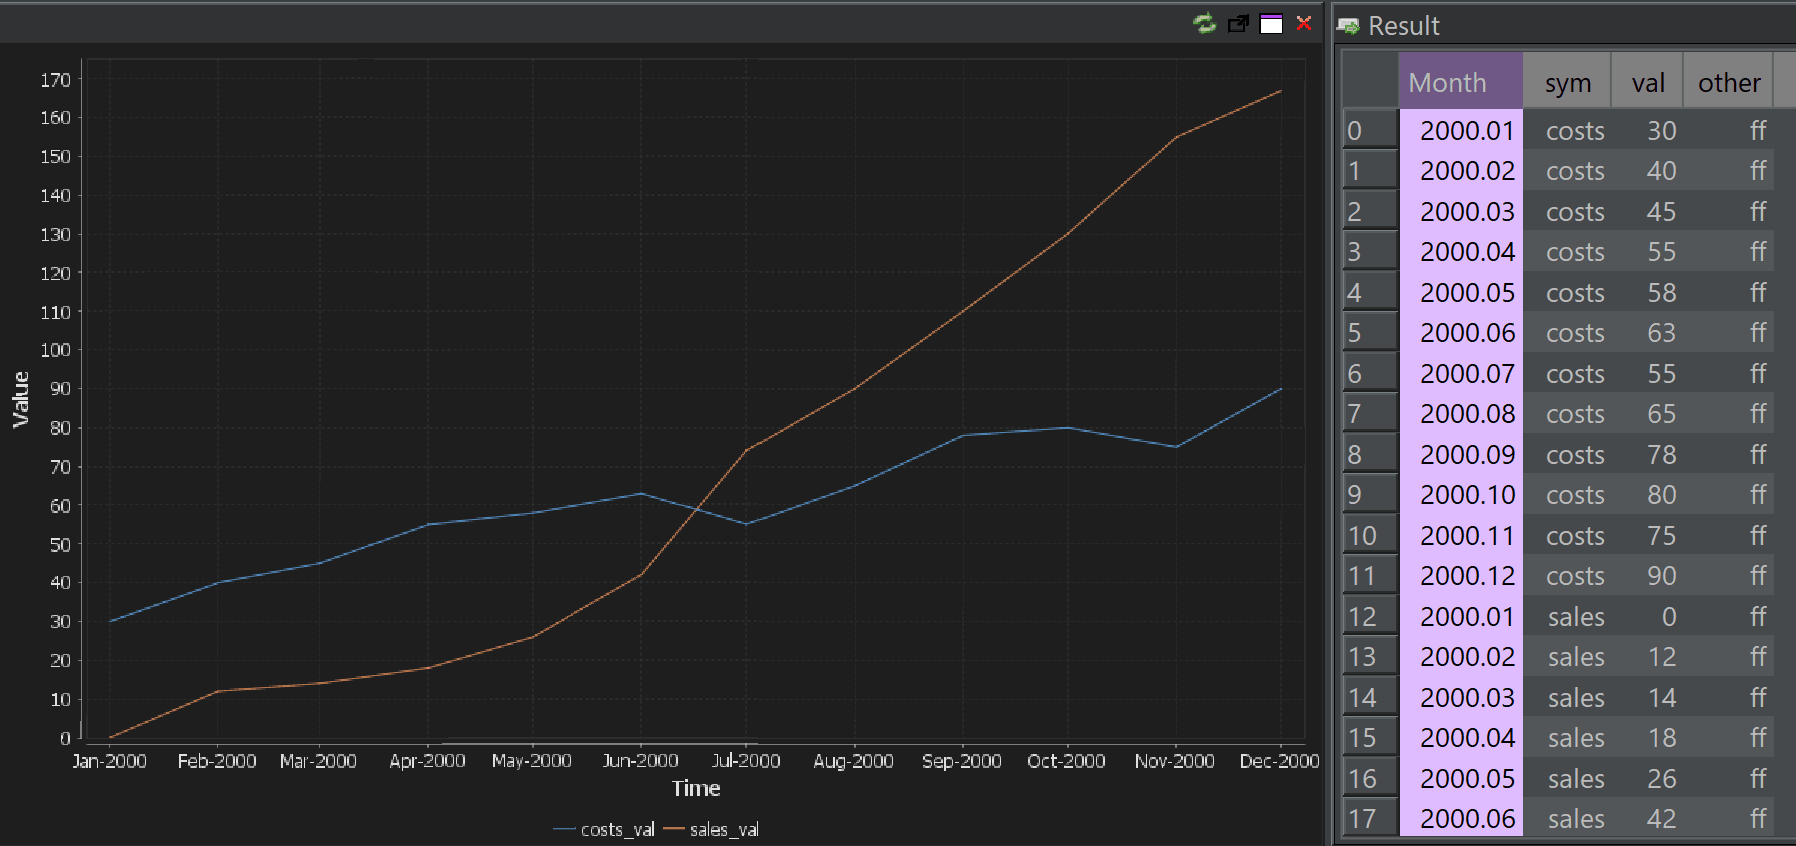
Each row represents a single observation for one series at one point in time. This format is common in SQL queries and financial datasets.
| dt | sym | value |
|---|---|---|
| 2023-01-01 | A | 10.2 |
| 2023-01-01 | B | 12.5 |
| 2023-01-02 | A | 10.8 |
| 2023-01-02 | B | 12.9 |
When QStudio can unambiguously identify a series dimension, it automatically pivots the data so each series becomes its own line on the chart.
Automatic Time-Series Pivoting
Automatic pivoting reduces boilerplate SQL and allows common time-series queries to work without manual reshaping. It is intentionally conservative to avoid misleading charts.
Conditions Required for Auto-Pivot
All of the following must be true:
- Exactly one time column (date, timestamp, or time).
- Exactly one numeric value column.
-
One non-numeric column that:
- Low cardinality (e.g. symbol, metric)
- More than one distinct value
- No duplicate (time, series) combinations
- The time column is not already unique; if every row has a unique timestamp, no pivot is needed.
Why These Rules Exist
- Ensure there is a single, clear series dimension.
- Prevent accidental pivots when multiple categorical columns exist.
- Avoid silent aggregation or data loss.
- If the structure is ambiguous, the data is rendered exactly as returned.
If auto-pivoting fails for any reason, QStudio safely falls back to the original result set and renders it unchanged.