Archive for the 'qStudio' Category
January 22nd, 2024 by admin
The java core feature qStudio relied on for license key authentication has been removed in java 17. If you are using a version of qStudio lower than 2.53 you MUST upgrade this year. Download qStudio now.
- Old license keys and old versions of qStudio cannot work on java 17+ as the core java library is removed.
- qStudio 2.53+ released 2023-08-14 will accept both old and new license keys and work on java 8/9/11/17 …. everything. – Download it now.
- All keys provided from 2024-01-01 have been using the new key format. These keys start with QSV3.
We really wish 11+ years ago we hadn’t chosen this particular library but what can you do 🙂
Existing enterprising customers may be issued an old key for exceptional circumstances. If absolutely required, get in touch.
January 11th, 2024 by admin
We just launched a new sql documentation website: sqldock.com
to allow integration with Pulse / qStudio and docs more easily.
More updates on this integration will be announced shortly. 🙂
August 15th, 2023 by Ryan Hamilton
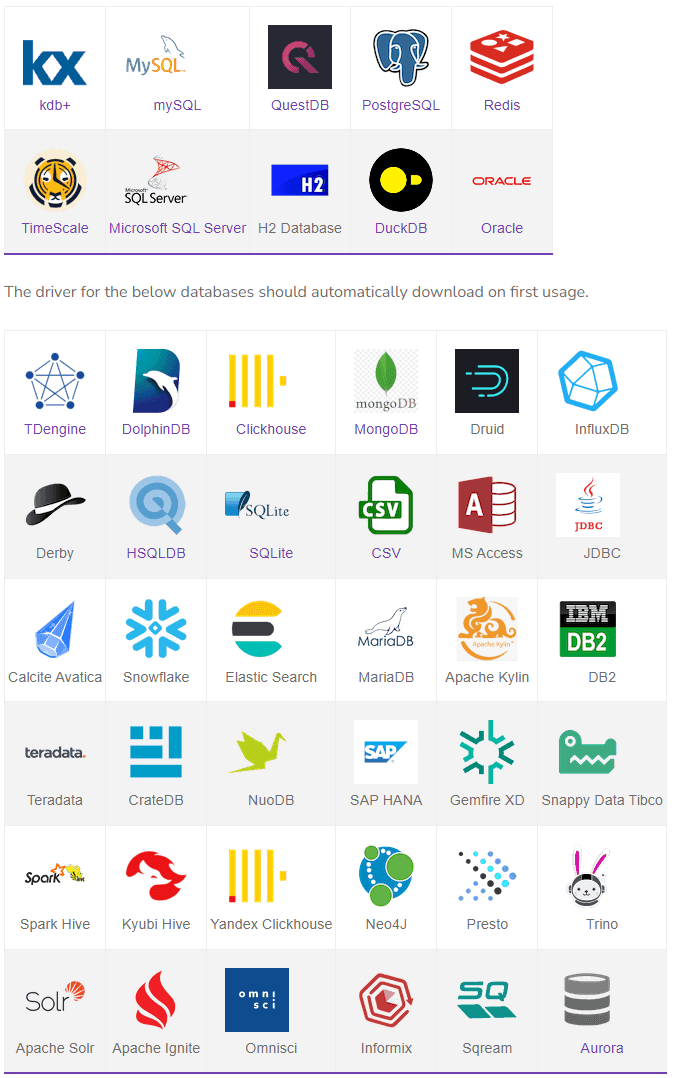
Support for 30+ databases has now been added to both qStudio and Pulse.
Clickhouse, Redis, MongoDB, Timescale, DuckDB, TDEngine and the full list shown below are all now supported.
// Supports Every Popular Database
Pulse is being used successfully to deliver data apps including TCA, algo controls, trade blotters and various other financial analytics. Our users wanted to see all of their data in one place without the cost of duplication. Today we released support for 30+ databases.
“My market data travels over ZeroMQ, is cached in Reddit and stored into QuestDB. While static security data is in SQL server. With this change to Pulse I can view all my data easily in one place.” – Mark – Platform Lead at Crypto Algo Trading Firm.
// Highlighted Partners
In particular we have worked closely with chosen vendors to ensure compatibility.
A number of vendors have tested the system and documented setup on their own websites:
- TDEngine – Open-source time series database purpose-built for the IoT (Internet of Things).
- QuestDB – Open source time-series database with a similar architecture to kdb+ that supports last-by and asof joins. See our crypto Pulse demo.
- TimeScale – PostgreSQL++ for time series and events, engineered for speed.
- ClickHouse and DuckDB – Were tested by members of their community and a number of improvements made.
// The Big Picture
Download Pulse 1.36
Download qStudio 2.52
March 27th, 2023 by John Dempster
qStudio release 2.05 added:
- Mac / Intellij / Flat / Material Theme support
- Inlcuding 20+ Intellij and 20+ Material Themes builtin
- Scaling font size in settings increases code size and all font sizes throughout the UI
- Jetbrains Mono is now bundled as the default Font for development
Notice Also
- The menu bar is now integrated with the title on platforms with that enabled (Windows 10/11)
- File chooser now includes shortcuts to popular locations
- Native window decorations on Windows 10 – Snapping / Shadows / etc.
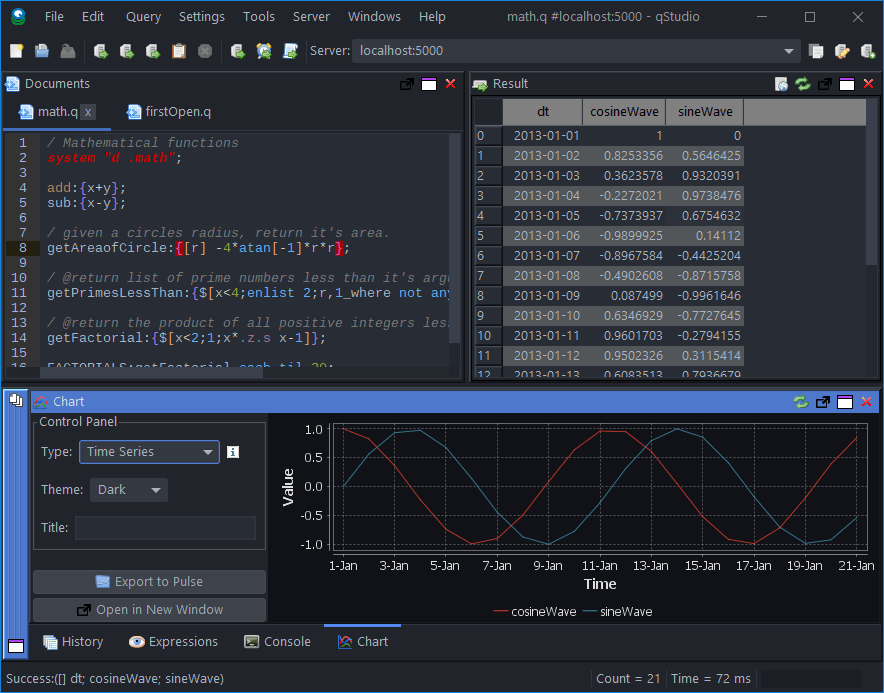
qStudio Dark Theme
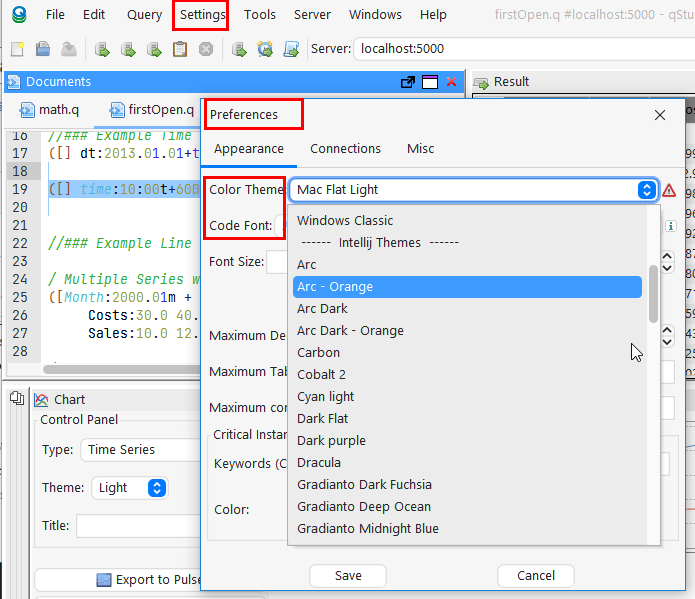
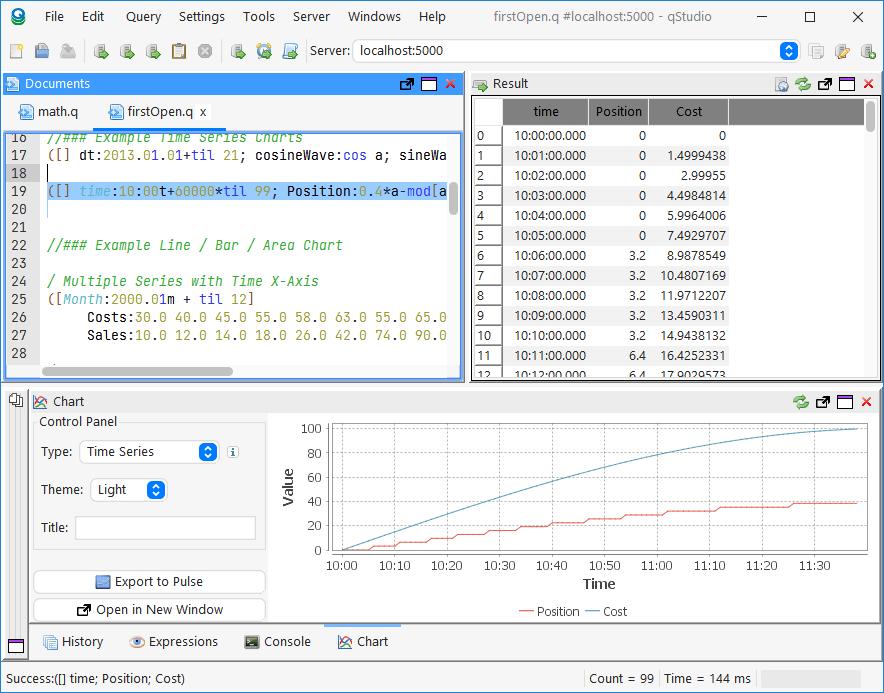
qStudio Light Mac Theme
October 12th, 2022 by Ryan Hamilton
qStudio is the number one code editor, server browser and development environment for kdb+.
Today we are launching Pulse, a real-time SQL visualization tool for almost any SQL database.
Within Pulse we have recreated almost all the functionality of qStudio in web form.
If you’ve ever wanted to:
- Share queries and results
- Run analysis from any machine with a browser without a need to install qStudio
- Chart results using a modern charting library
You should consider using Pulse as a shared HTML5 based complement to qStudio..
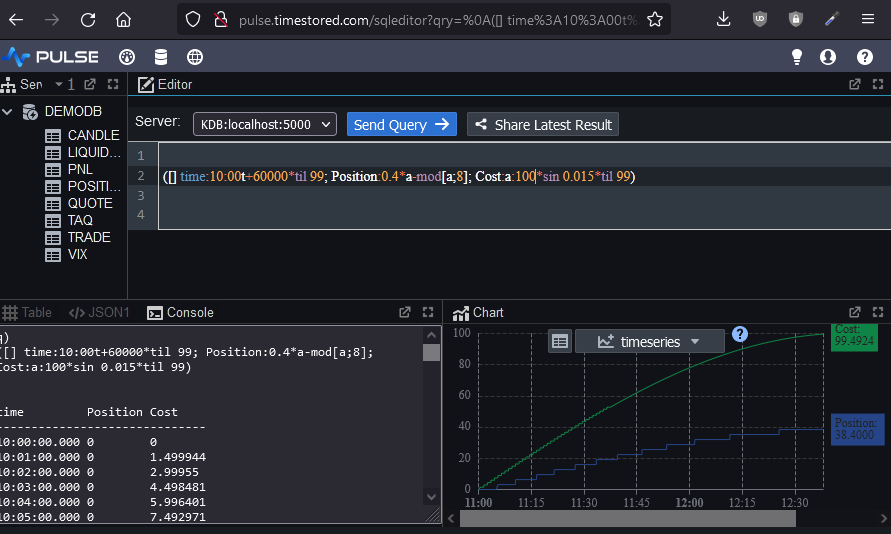
As you can see below, pulse can be made to look almost the exact same as qStudio. It features the familiar configurable layout with a table/console/charting result panel that allows you to see your result in all formats at once.
Additionally you can
- Bookmark,copy and share links
- Use it with kdb+, postgresql, mysql, oracle and H2 databases
- Try many more chart types including 3D.
Try Pulse Now
April 2nd, 2018 by admin
qStudio 1.45 Released, we have:
- Bugfix: Ctrl+F Search in source fixed. (Thanks Alex)
- Added Step-Plot Chart display option
- Added Stacked Bar Chart display option
- Added Dot graph render display option (Inspired by Noormo)
- Bugfix: Hidden folders/files regex now works again in file tree and command bar. Target and hidden folders are ignored by default.
- Bugfix: Mac was displaying startup error with java 9
Download
Some example charts:
April 2nd, 2018 by admin
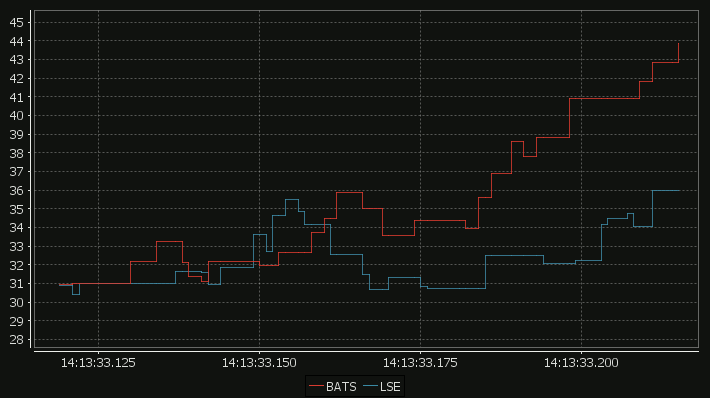
Our standard time-series graph interpolates between points. When the data you are displaying is price points, it’s not really valid to always interpolate. If the price was 0.40 at 2pm then 0.46 at 3pm, that does not mean it could be interpreted as 0.43 at 2.30pm. Amazingly till now, sqlDashboards had no sensible way to show taht data. Now we do:
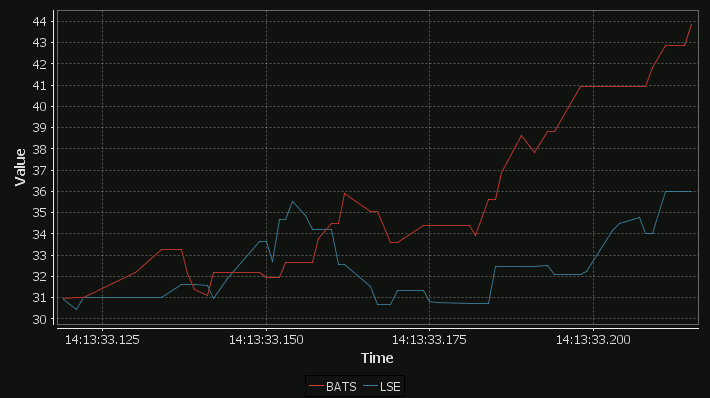
For comparison here is the same data as a time-series graph:
The step-plot is usable for time-series and numerical XY data series. The format is detailed on the usual chart format pages.
April 2nd, 2018 by admin
qStudio has added support for stacked bar charts:
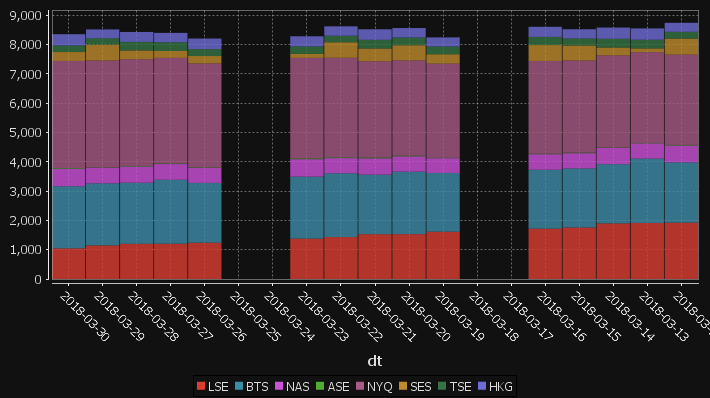
The chart format for this is: The first string columns are used as category labels. Whatever numeric columns appear next are a separate series in the chart. Each row in the data becomes one stacked bar. The table for the data shown above for example is:
| dt |
LSE |
BTS |
NAS |
ASE |
NYQ |
SES |
TSE |
HKG |
| 2018-03-30 |
1047 |
2120 |
592 |
25 |
3660 |
303 |
225 |
383 |
| 2018-03-29 |
1148 |
2118 |
528 |
10 |
3656 |
541 |
215 |
303 |
| 2018-03-28 |
1201 |
2085 |
555 |
17 |
3644 |
302 |
290 |
339 |
| 2018-03-27 |
1206 |
2182 |
535 |
21 |
3604 |
235 |
299 |
319 |
| 2018-03-26 |
1239 |
2041 |
515 |
16 |
3549 |
251 |
234 |
363 |
| 2018-03-25 |
0 |
0 |
0 |
0 |
0 |
0 |
0 |
0 |
| 2018-03-24 |
0 |
0 |
0 |
0 |
0 |
0 |
0 |
0 |
| 2018-03-23 |
1379 |
2115 |
595 |
29 |
3430 |
138 |
251 |
348 |
| 2018-03-22 |
1431 |
2179 |
517 |
25 |
3399 |
531 |
222 |
320 |
| 2018-03-21 |
1530 |
2032 |
558 |
29 |
3282 |
438 |
296 |
359 |
| 2018-03-20 |
1531 |
2134 |
520 |
23 |
3256 |
515 |
265 |
322 |
You may need to “kdb pivot” your original data to get it in the correct shape.
April 1st, 2018 by Ryan Hamilton
“The Financial Information eXchange (FIX) protocol is an electronic communications protocol initiated in 1992 for international real-time exchange of information related to the securities transactions and markets.”. You can see an example of a FIX message being parsed here.
What we care about is that an order goes through a lifecycle. From newly created to filled or removed. Anything that involves state-transitions or a lifecycle can be visualized as a graph. A graph depicts transitions from one state to another. Often SQL tables record every transition of that state. This can then be summarised into a count of the last state, giving something like the following:
| From |
To |
label |
cnt |
| PendingCancel |
Calculated |
Rejected |
50 |
| PendingReplace |
Calculated |
Rejected |
10 |
| PendingReplace |
Calculated |
Replaced |
40 |
| Calculated |
PendingReplace |
PendingReplace |
50 |
| Calculated |
Filled |
Trade |
9400 |
| Calculated |
Calculated |
Trade |
5239 |
| PendingCancel |
Removed |
Cancelled |
150 |
| Calculated |
PendingCancel |
PendingCancel |
200 |
| New |
Calculated |
Calculated |
9660 |
| New |
Removed |
Rejected |
140 |
| Created |
Removed |
Rejected |
300 |
| Created |
New |
New |
9800 |
qStudio now automatically converts this result table to DOT format and if you have graphviz“>graphviz installed and on the PATH, will generate the following:
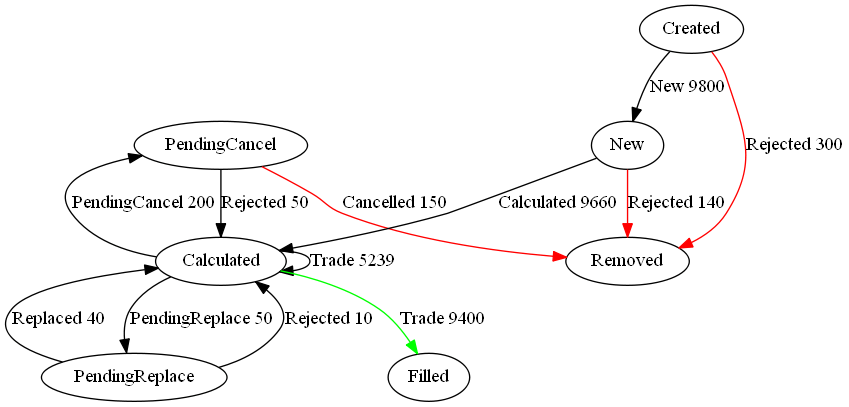
Note I did tweak the table a little to add styling like so:
update style:(`Filled`Removed!("color=green";"color=red")) To,label:(label,'" ",/:cnt) from currentFixStatus
The format is detailed again in our qStudio Chart Data Format page.
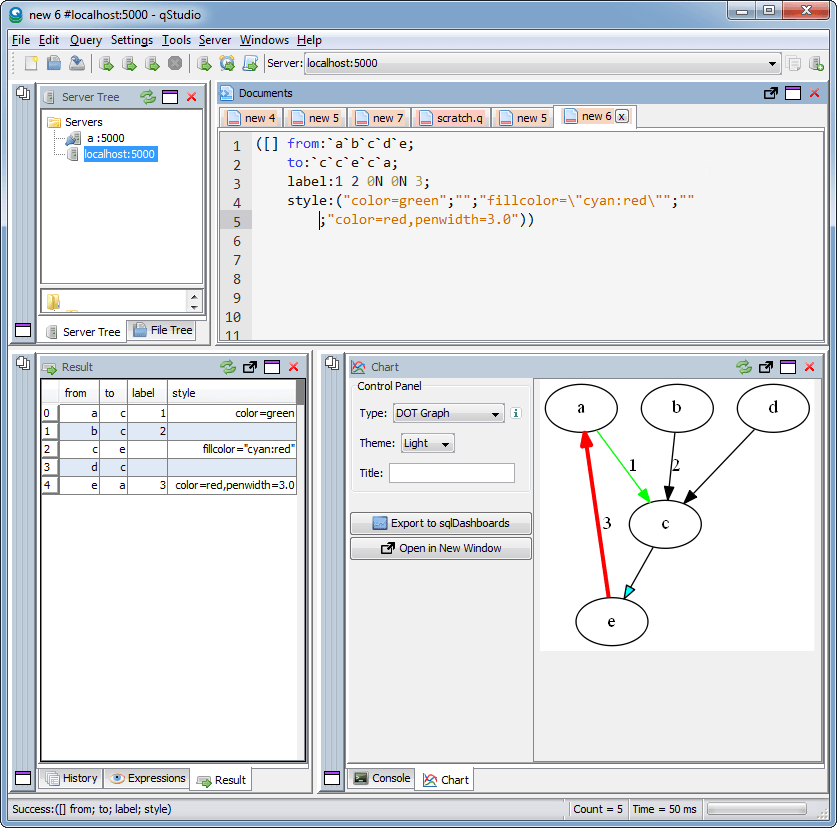
This is another even simpler example:
April 13th, 2017 by Ryan Hamilton
qStudio 1.43 Released. This:
- Adds stack traces to kdb 3.5+
- Fixes the mac bug where the filename wasn’t shown when trying to save a file.
- Fixes a number of multi-threading UI problems
Download it now.