It’s been 2 years since I worked full time in kdb+ but people seem to always want to talk to me about kdb+ and where I think it’s going, so to save rehashing the same debates I’m going to put it here and refer to it in future. Please leave a comment if you want and I will reply.
Let’s first look at the use cases for kdb+, consider the alternatives, then which I think will win for each use-case and why.
Use Cases
A. Historical market data storage and analysis. – e.g. MS Horizon, Citi CloudKDB, UBS Krypton (3 I worked on).
B. Local quant analysis – e.g. Liquidity analysis, PnL analysis, profitability per client.
C. Real-time Streaming Calcuation Engines – e.g. Streaming VWAP, Streaming TCA…
D. Distributed Computing – e.g. Margin calculations for stock portfolios or risk analysis. Spread data out, perform costly calcs, recombine.
Alternatives
Historical Market Data – kdb+ Alternatives
A large number of users want to query big data to get minute bars, perform asof joins or more advanced time-series analysis.
New Database Technologies – Clickhouse, QuestDB.
Cloud Vendors – Bigquery / redshift
Market Data as a Service
Let me tell you three secrets, 1. Most users don’t need the “speed” of kdb+. 2. Most internal bank platforms don’t fully unleash the speed of kdb+. 3. The competitors are now fast enough. I mean clickbench are totally transparent on benchmarking..
Likely Outcome: – Kdb+ can hold their existing clients but haven’t and won’t get the 2nd tier firms as they either want cloud native or something else. The previous major customers for this had to invest heavily to build their own platform. As far as I’m hearing the kdb cloud platform still needs work.
Local Quant Analysis – Alternatives
Python – with DuckDB
Python – with Polars
Python – with PyKX
Python – with dataframe/modin/….
Now I’m exaggerating slightly but the local quant analysis game is over and everyone has realised Python has won. The only question is who will provide the speedy add-on. In one corner we have widely popular free community tools that know how to generate interest at huge scale, are fast and well funded. In the other we have a niche company that never spread outside finance, wants to charge $300K to get started and has an exotic syntax.
Likely Outcome: DuckDB or Polars. Why? It’s free. People at Uni will start with it and not change. Any sensible quant currently in a firm will want to use a free tool so that they are guaranteed to be able to use similar analytics at their next firm. WIthout that ability they can only go places that have kdb+ else face losing a large percentage of their skillset.
Real-time Streaming / Distributed Computing
These were always the less popular cases for kdb+ and never the ones that “won” the contract. The ironic thing is, combining streaming with historical data in one model is kdbs largest strength. However the few times I’ve seen it done, it’s either taken someone very experienced and skillful or it has become a mess. These messes have been so bad it’s put other parts of the firm off adopting kdb+ for other use cases.
Likely Outcome: Unsure which will win but not kdb+. Kafka has won mindshare and is deployed at scale but flink/risingwave etc. are upcoming stars.
Summary
Kdb+ is an absolutely amazing technology but it’s about the same amazing today as it was 15 years ago when I started. In that time the world has moved on. The best open source companies have stolen the best kdb+ ideas:
Parquet/Iceberg is basically kdb+ on disk format for optimized column storage.
Apache Arrow – in-memory format is kdb+ in memory column format.
Even Kafka log/replay/ksql concept could be viewed as similar to a tplog viewed from a certain angle.
QuestDB / DuckDB / Clickhouse all have asof joins
Not only have the competitors learnt and taken the best parts of kdb+ but they have standardised on them. e.g. Snowflake, Dremio, Confluent, Databricks are all going to support Apache Iceberg/parquet. QuestDB / DuckDB / Python are all going to natively support parquet. This means in comparisons it’s no longer KX against one competitor, it’s KX against many competitors at once. If your data is parquet, you can run any of them against your data.
As many at KX would agree I’ve talked to them for years on issues around this and to be fair they have changed but they are not changing quick enough.
They need to do four things:
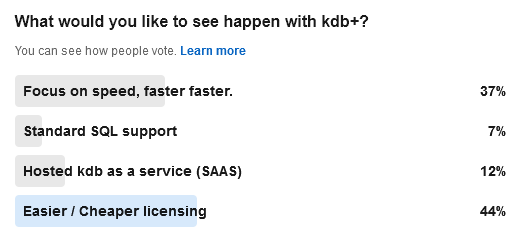
Get a free version out there that can be used for many things and have an easy reasonable license for customers with less money to use.
Focus on making the core product great. – For years we had Delta this and now it’s kdb.ai. In the meantime mongodb/influxdb won huge contracts with a good database alone.
Reduce the steep learning curve. Make kdb+ easier to learn by even changing the language and technology if need be.
You must become more popular else it’s a slow death
This is focussing on the core tech product.
Looking more widely at their financials and other huge costs/initiatives such as AI and massive marketing spending, wider changes at the firm should also be considered.
2024-08-03: This post got 10K+ views on the front page of Hacker News to see the followup discussion go here.
One user suggested Deferred Sync. I’m not including it as I think the implementation is bad and encourages code that would be unsafe and dangerous. To get an idea of why, see this excellent article: https://journal.stuffwithstuff.com/2015/02/01/what-color-is-your-function/
QStudio is the best SQL IDE for data analysis. DuckDB is the best free database for OLAP analytical queries.
Together they provide a powerful desktop platform for data analysis.
Powerful Local Database – qDuckDB is now at the core of qStudio.
Save Locally – Convert a query result from any database to store it locally.
Parquet File Viewer – Click to open a parquet file on windows.
Parquet is the stored data standard of the future and works with everything.
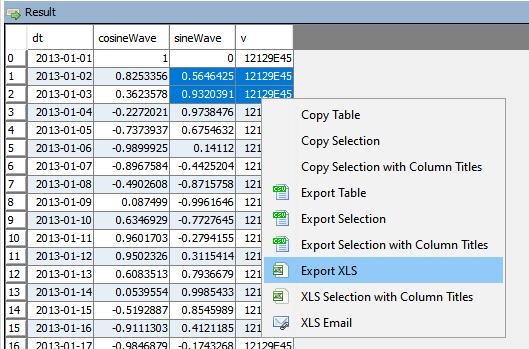
qStudio now allow you to export to XLS.
This should solve most the text escape problems we have seen before. e.g. Double quotes, single quotes, scientific notation.
XLS Email will open outlook with the text location of the file as the first line in the message.
You should cut that line, click “Add Attachment”, then paste the line to quickly form an email.
It wasn’t possible to easily attach a file across windows, linux and mac.
The java core feature qStudio relied on for license key authentication has been removed in java 17. If you are using a version of qStudio lower than 2.53 you MUST upgrade this year. Download qStudio now.
Old license keys and old versions of qStudio cannot work on java 17+ as the core java library is removed.
qStudio 2.53+ released 2023-08-14 will accept both old and new license keys and work on java 8/9/11/17 …. everything. – Download it now.
All keys provided from 2024-01-01 have been using the new key format. These keys start with QSV3.
We really wish 11+ years ago we hadn’t chosen this particular library but what can you do 🙂
Existing enterprising customers may be issued an old key for exceptional circumstances. If absolutely required, get in touch.
We just launched a new sql documentation website: sqldock.com
to allow integration with Pulse / qStudio and docs more easily.
More updates on this integration will be announced shortly. 🙂
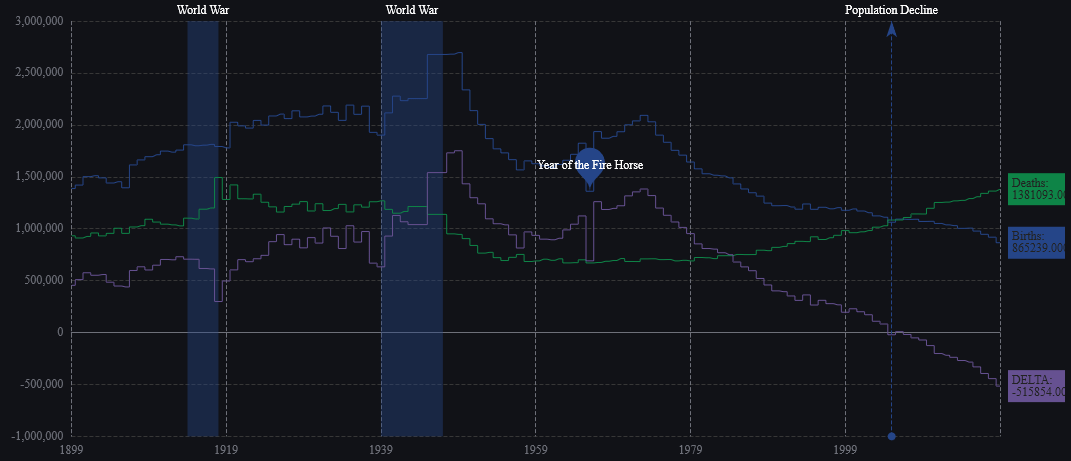
We have been working on version 2.0 of Pulse with a select group of advance users for weeks now. To give you a preview of one new feature, check out markers shown on the chart below. We have marker points, lines and areas.For example this will allow adding a news event to a line showing a stock price. This together with many other changes should be released soon as part of 2.0.
Pulse is specialized for real-time interactive data, as such it needs to be fast, very fast. When we first started building Pulse, we benchmarked all the grid components we could find and found that slick grid was just awesome, 60East did a fantastic writeup on how Slick grid compares to others. As we have added more features, e.g. column formatting, row formatting, sparklines…..it’s important to constantly monitor and test performance. We have:
Automated tests that check the visual output is correct.
Throughput tests to check we can process data fast enough
Manual tests to ensure subtle human interactions work.
Memory leak checks as our dashboards can be very long running.
Today I wanted to highlight how our throughput tests work by looking at our grid component.
HTML Table Throughput Testing
To test throughput we:
Use scenarios as close to our customers typical use cases as possible.
The most common query being a medium sized scrolling trade blotters with numerical/date formatting and row highlighting.
200 rows of data, scrolling 50 rows each update.
We use a subscription connection to replay and render 1000s of data points as fast as possible.
Video Demonstrating 21,781 rows being replayed as 435 snapshots taking 16 seconds = 27 Updates per second. (European TV updates at 25 FPS).
Update: After this video we continued making improvements and with a few days more work got to 40 FPS.
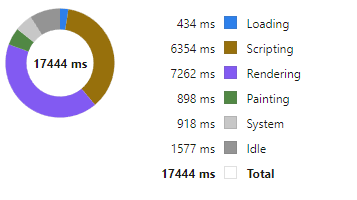
Profiling Slick Grid Table
Breakdown
We then examine in detail where time is being spent. For example we:
Turn on/off all formatting, all rendering options.
Add/Remove columns
Change screen sizes
Change whether edit mode is on or table cells have been select (Off fact: selecting a cell makes the grid 30% slower to update)
Then we try to improve it!
Often this is looking at micro optimizations such as reducing the number of objects created. For example the analysis of how to format columns is only performed when columns change not when data is updated with the same schema. The really large wins tend to be optimizing for specific scenarios, e.g. a lot of our data is timestamped and received mostly in order. But those optimization are for a later post.
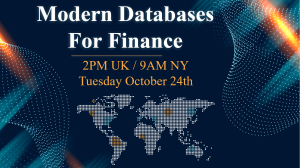
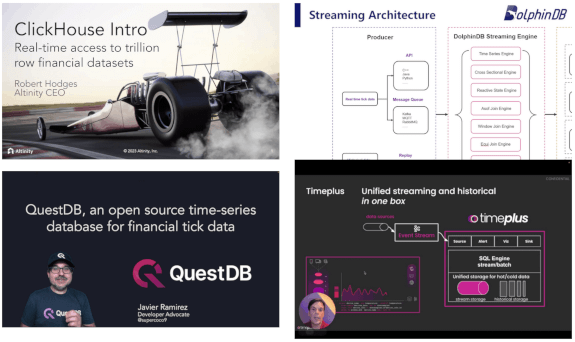
We just announced a unique event that gathers 4 of the newest, most advanced databases for Finance into 1 hour:
If you work on big data in Finance, this is your chance to get an overview of the rapidly changing database landscape. TimeStored will be organizing a free online presentation, each database company will present 10 minutes on what is unique to their solution. Bringing together the top new technologies together in one place.