Pulse is specialized for real-time interactive data, as such it needs to be fast, very fast. When we first started building Pulse, we benchmarked all the grid components we could find and found that slick grid was just awesome, 60East did a fantastic writeup on how Slick grid compares to others. As we have added more features, e.g. column formatting, row formatting, sparklines…..it’s important to constantly monitor and test performance. We have:
Automated tests that check the visual output is correct.
Throughput tests to check we can process data fast enough
Manual tests to ensure subtle human interactions work.
Memory leak checks as our dashboards can be very long running.
Today I wanted to highlight how our throughput tests work by looking at our grid component.
HTML Table Throughput Testing
To test throughput we:
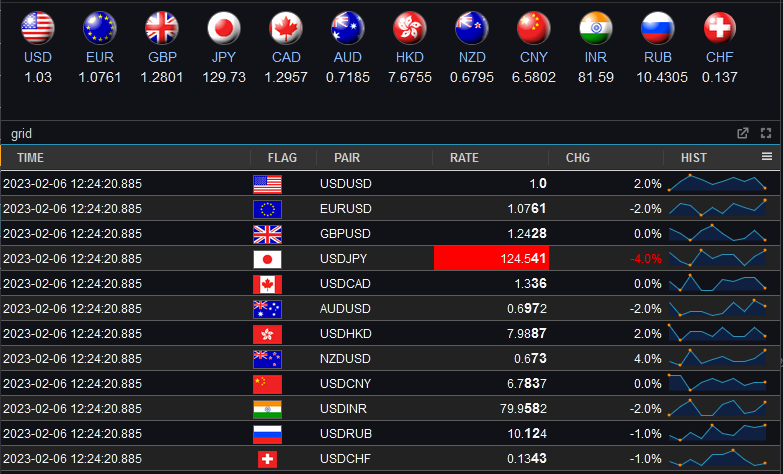
Use scenarios as close to our customers typical use cases as possible.
The most common query being a medium sized scrolling trade blotters with numerical/date formatting and row highlighting.
200 rows of data, scrolling 50 rows each update.
We use a subscription connection to replay and render 1000s of data points as fast as possible.
Video Demonstrating 21,781 rows being replayed as 435 snapshots taking 16 seconds = 27 Updates per second. (European TV updates at 25 FPS).
Update: After this video we continued making improvements and with a few days more work got to 40 FPS.
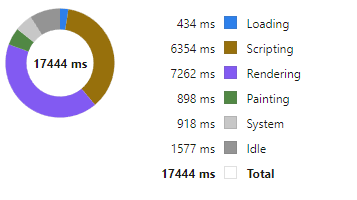
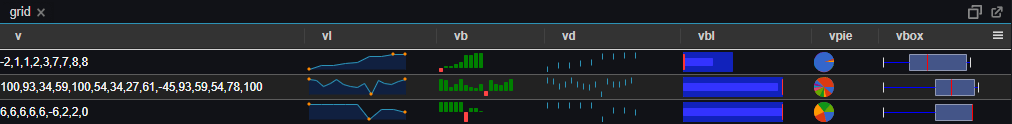
Profiling Slick Grid Table
Breakdown
We then examine in detail where time is being spent. For example we:
Turn on/off all formatting, all rendering options.
Add/Remove columns
Change screen sizes
Change whether edit mode is on or table cells have been select (Off fact: selecting a cell makes the grid 30% slower to update)
Then we try to improve it!
Often this is looking at micro optimizations such as reducing the number of objects created. For example the analysis of how to format columns is only performed when columns change not when data is updated with the same schema. The really large wins tend to be optimizing for specific scenarios, e.g. a lot of our data is timestamped and received mostly in order. But those optimization are for a later post.
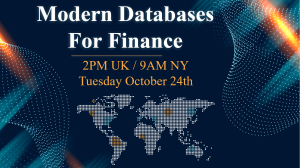
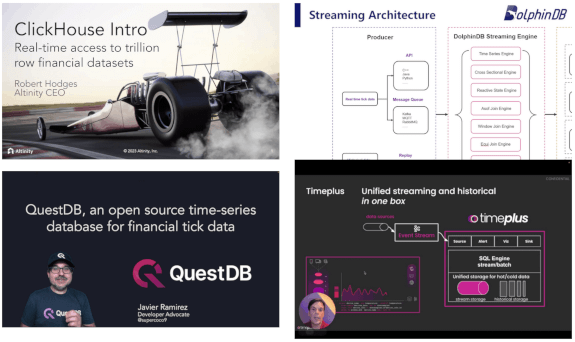
We just announced a unique event that gathers 4 of the newest, most advanced databases for Finance into 1 hour:
If you work on big data in Finance, this is your chance to get an overview of the rapidly changing database landscape. TimeStored will be organizing a free online presentation, each database company will present 10 minutes on what is unique to their solution. Bringing together the top new technologies together in one place.
Our latest product Pulse is for displaying real-time interactive data direct from any database. To get most benefit, the underlying databases need to be fast (<200ms queries). For our purposes databases fall into 2 categories:
Really really fast, can handle queries every 200ms or less and seamlessly show data scrolling in
All Other Databases. The 95%+.
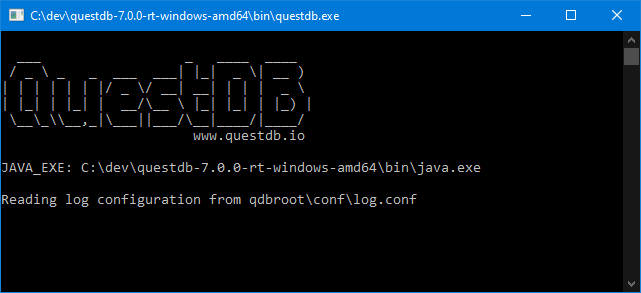
It’s very exciting when we find a new database that meets that speed requirement. I went to the website, downloaded QuestDB and ran it. Coming from kdb+ imagine my excitement at seeing this UI:
Good News:
A very tiny download (7MB .jar file)
There’s a free open source version
They are focussed on time-series queries
Did I mention it’s fast
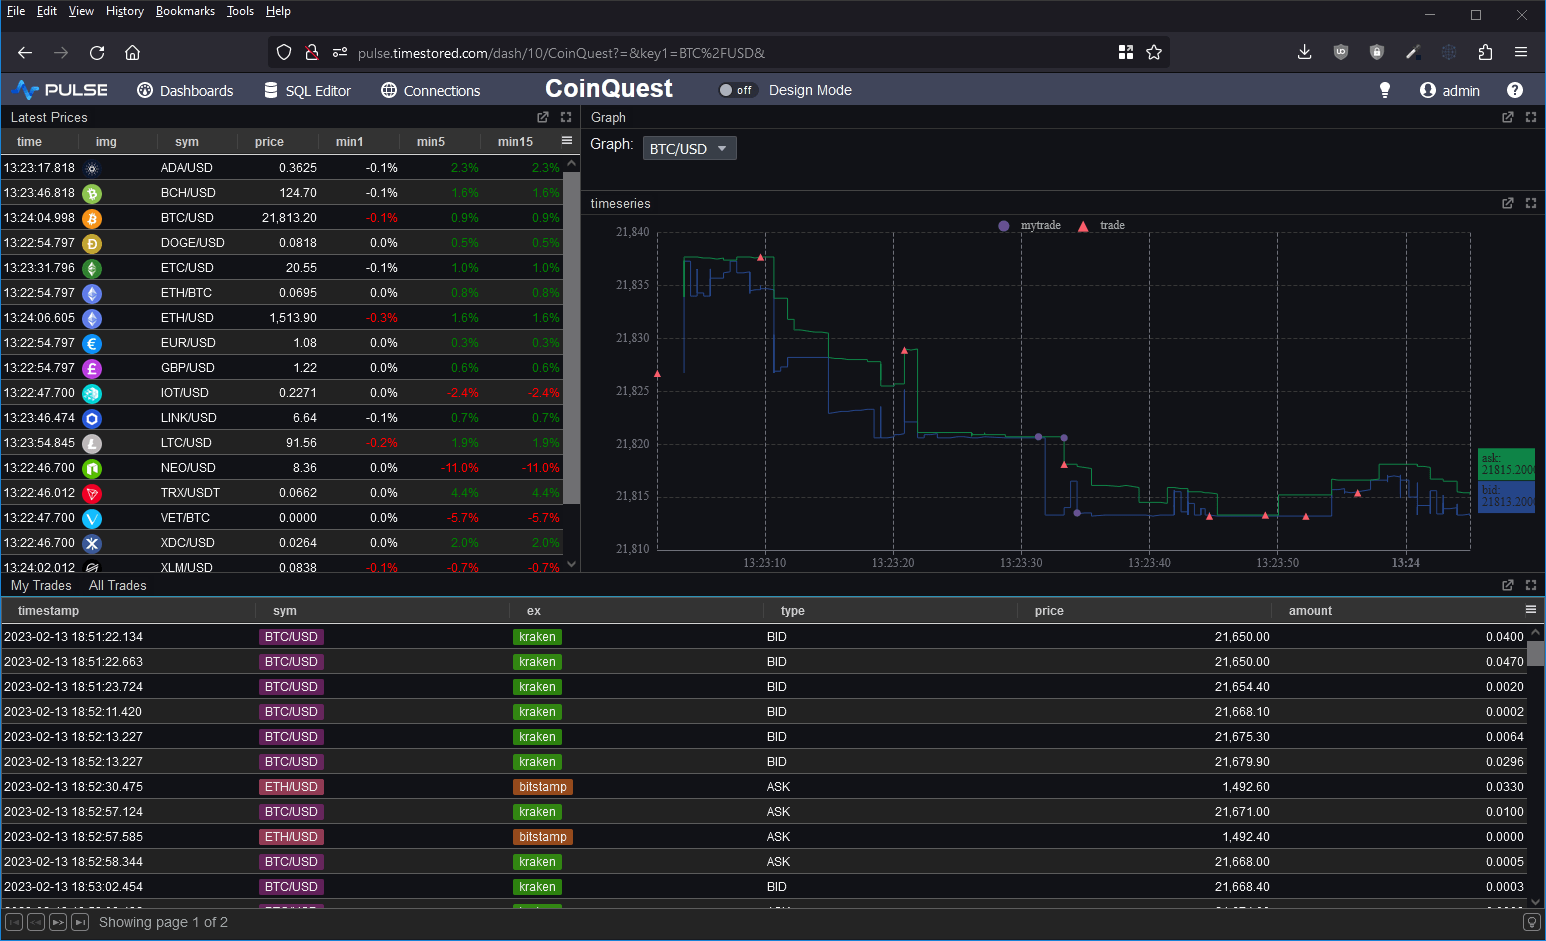
I wanted to take it for a spin and to test the full ingestion->store->query cycle. So I decided to prototype a crypto dashboard. Consume data from various exchanges and produce a dashboard of latest prices, trades and a nice bid/ask graph as shown below.
Good Points
It simply worked.
QuestDB chose to be PostgreSQL wire and query compatible. A great technical choice as:
It will work with many tools including Pulse without complication
Many people already know SQL. I’ve been teaching q/kdb for years and when people learn it, you can use it for absolutely amazing things that standard SQL is terrible at. However most people do not reach that level of expertise. By using standard SQL more people can reuse their existing knowledge.
They then added Time-series specific extensions ontop for querying, including:
“Latest on” – that’s equivalent to kdbs “last by”. It’s used to generate the “latest prices” table in the dashboard with a 1/5/15 minute lag.
QuestDB can automatically create tables when you first send data, there’s no need to send “Create Table …”. This was useful when I was tweaking the data layout from the crypto feeds.
At parts my SQL was rusty and I asked for help on their slack channel. Within an hour I got helpful responses to both questions.
Within a very short time, I managed to get the database populated and the dashboard live running. This is the first in a long time that a database has gotten me excited. It seems these guys are trying to solve the same user problems and ideas that I’ve seen everywhere. There were however some significant feature gaps.
Feature Gaps
No nested arrays. If I want to store bid/asks, I can only currently do it with columns bid1/bid2/bid3, no arbitrary length arrays.
Very limited window analytics. Other than “LATEST ON” QuestDB won’t let me perform analysis within that time window or within arrays in general.
I really missed my
`time xasc (uj/)(table1;table2)
pattern for combining multiple tables into one. For the graph I had to use a lengthy SQL UNION.
In general kdb+ has array types and amazingly lets you use all the same functions that work on columns on nested structures. I missed that power.
No security on connections. It seems security integration will be an enterprise feature.
Open Source Alternative to kdb+ ?
Overall I would say not yet but they seem to be aiming at a similar market and they are moving fast.
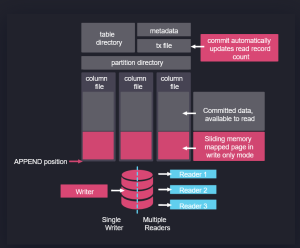
In fact, if you look at their architecture on the right, it’s obvious some of their team have used kdb+. Data is partitioned on date, with a separate folder per table and a column per file. Data is mapped in when read and appended when new data arrives.
In some ways this architecture predates kdb+ and originates from APL. It’s good to see new entrants like QuestDB and apache arrow pick up these ideas, make them their own and take them to new heights. I think kdb+ and q are excellent, I was always frustrated that it has remained niche while inferior technical solutions became massively popular, if QuestDB can take time-series databases and good technical ideas to new audiences, I wish them the best of luck!
Please leave any of your thoughts or comments below as I would love to hear what others think.
If you want to see how to setup QuestDB and a crypto dashboard yourself, we have a video tutorial:
Over the last few months, I’ve discussed grid components, aggregating and pivoting with a lot of people. You would not believe how much users want to see a good grid component that allows drill down and how strongly they hold opinions on certain solutions. I have examined a lot of existing solutions, everything from excel, to powerBI, Oracle, DuckDB, hypertree, grafana, tableau……. I think I’m beginning to converge these ideas and requests into a pivot table that will be a good solution for our users:
Like all of our work, it should be really really fast
It must work with Big Data
It should be Friendly
It must allow changing aggregations – e.g. Group by exchange OR group by exchange and sym
Allow pivoting some calculations – from one column to a breakdown in separate columns
It must work for all databases.
Well now the proposed interface looks like this:
Pulse - Pivot
A lot of the functionality inspiration should be credited to Stevan Apter and HyperTree. Ryan had seen HyperTree and loved the functionality and beautiful kdb only implementation. The challenge was to allow similar functionality for all databases while making it more accessible. We now have a working demo version.
If you love pivot tables and have never got to see your dream grid component come to fruition, we want to build it, so get in touch.
I won’t go through the full list of great presentations as Gary Davies has that excellently covered but I will highlight some trends I saw at kxcon 2023:
APIs are powerful abstractions that users need and love –
Erin Stanton (Virtu) – Brought massive amounts of energy to her presentation, showing how accessing powerful “getData” APIs from python->kdb allowed Erin to run machine learning models in minutes rather than hours. As a python enthusiast she was very happy to use the power of kdb without having to know it well. Erin demonstrated an easily browsable web interface that allowed data discovery, provided documentation and could be used to run live data queries.
Alex (TD) – Similarly discussed how his team all used python wrapped APIs to allow sharing smart query defaults such as ignoring weekend data to prevent less sophisticated users from shooting themselves in the foot.
Igor (Pimco) – Mentioned the power of APIs and how hiding the tables allowed changing implementations later.
Python is super popular
Citadel, Alex (TD), Erin (Virtu), Nick Psaris, Rebecca (Inqdata) all included significant python demonstrations.
Citadel – Has built an improved Python/Pykx process that uses a proxy thread to subscribe and publish updates extremely fast. They are using this as part of a framework to allow quants to publish data and construct DAGs (directed acyclic graphs) of calculations to produce analytics.
Why users love APIs and Python?
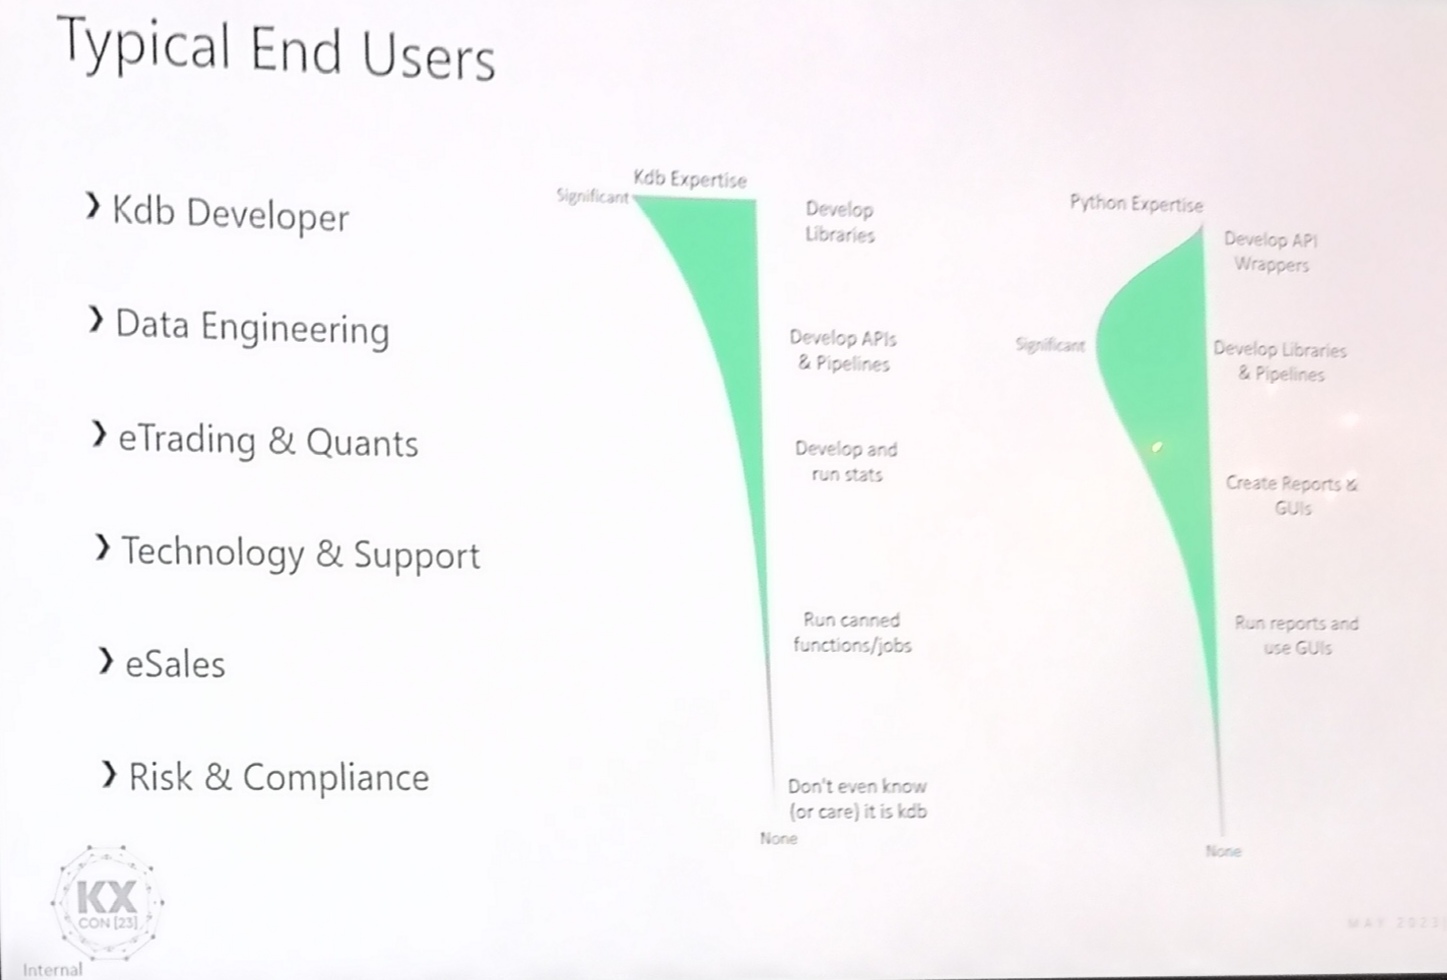
Alex Donohue’s presentation was packed with years of condensed knowledge , including the excellent diagram below showing typical user expertise. Notice as it transitions from backend kdb developers to frontend business users:
The level of kdb expertise drops off quickly (non-linear)
The data engineers and quants know much more python than kdb
I would like to add one more graph, showing business / domain knowledge.
That graph would be low for many kdb developers but higher for sales and trading.
Looking at it this way, makes it clear we need to provide APIs as users want to express queries in their own language.
Other Patterns at kx Con:
Small Teams can really deliver with kdb – Numerous times we heard how a small team used kdb to deploy a full solution quicker, that scaled better and ran faster than all alternatives.
But costly per CPU licensing can be restricting to those teams.
ChatGPT is everywhere – Rebeccas QuBot chatbot and Aaron Davies presentations demoed GPTs.
kdb now on AWS – kdb as a fully managed service under finspace – The website says available in June but at least one big investment bank is trialling it and having talked to a representative at AWS a significant amount of work and effort has gone into this. This is great to see. I think for the future of KX this needs to work. It doesn’t make sense for every firm to reinvent the wheel, banks could afford to do it but smaller firms cannot.
kdb.ai – seems to be repositioning kdb as a vector database for AI – currently it’s a few blog posts, whether there’s a real product or it’s to ride the AI hype train we will have to wait and see. Given the hype other inferior databases have received in the past, kdb deserves some attention.
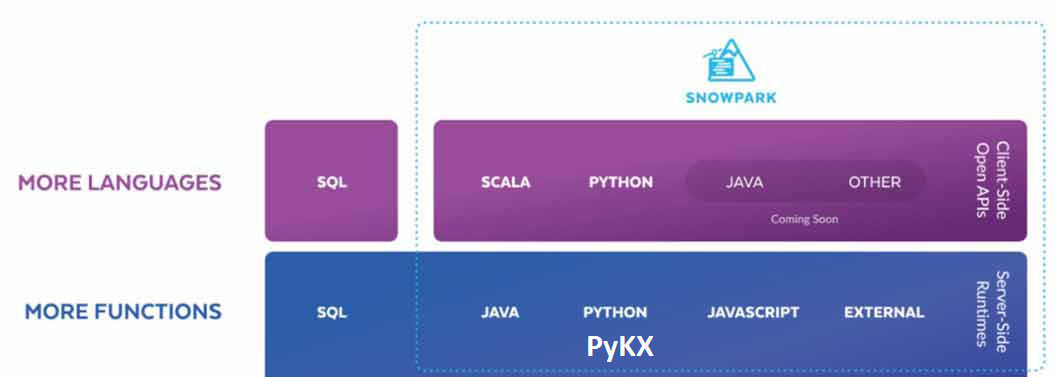
Run q code on Snowflake – Snowflake is a column oriented database that only runs in the cloud and uses a central storage with compute nodes to service SQL queries. They provide snowpark that allows running java, python and now q close to the data. I’m unsure who the target of this is, many users struggle to fully understand one database without inception.
Additionally kx:
announced PyKX will be open source?? (exact details to be confirmed, as repo is not available today 2023-05-21)
PyKX may add the ability to act as a very fast event processor
Announced improved vs code support will arrive shortly
The Core team demoed some really cool functionality, I’m not sure it was all meant to be public so I will just say some parts were similar to Destructuring Assignment in javascript.
Are you a Quant or kdb Developer struggling to get the UI team to work on your app?
With Pulse, you can now build interactive data tools fast by yourself.
Pulse version 1.0 is available to download now and allows you to build real-time interactive data apps, free for up to 3 users.
After an intense year working closely with groups of quants and data analysts, with releases every week, Pulse has reached a major milestone. Pulse 1.0 is being used successfully to deliver data apps including:
Event handlers allowing you to trigger queries, and perform other actions in response to user interactions.
A massive thanks to the many beta testers, early adopters, users and companies that invested in and purchased Pulse.
Particular thanks to Rahul, Ruairi, Ian, Steve, Chris, WooiKent, Franco, Palmit, JP, JD, PN, SG, JM, KF, AR, MC, JC, CA, SS. Thanks for raising numerous feature requests and providing excellent feedback that helped make Pulse what it is today.
Pulse is designed to provide real-time interactive dashboards so the underlying database has to be really fast. Pulse can support almost any data source, the question is which databases are worth supporting.
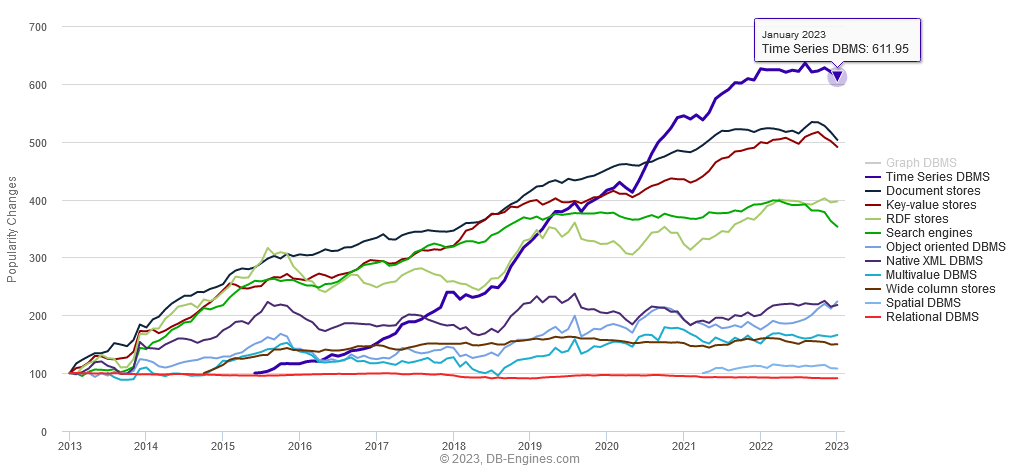
Time-series databases are the fastest growing database sector (image below).
The great news is that in the last few years there has been a a lot of interesting new entrants. So we’ve updated our past articles:
Top Column-Oriented Databases – DuckDB, Clickhouse and Doris are the new exciting entrants. Benchmark results in article.
Top Time-Series Databases – Have exploded in popularity. QuestDB and TimeScale are the new entrants there. Benchmark results in article.