2025-05-08 – Private equity firm TA announced an “All-Cash Offer to Acquire FD Technologies, Owner of Global Real-Time Analytics Leader KX”.
Most people are probably wondering how this came about:
1996 – Brian established First Derivatives (FD) in 1996 from his mother’s spare bedroom (Newry, Northern Ireland) with a loan of £5,000 from the Credit Union.
1998 – Kdb+ – In-memory column based database created by KX
KX and FD work in partnership to grow the business.
2014-10 – First Derivatives acquires a controlling stake in Kx Systems.
2018 – FD agrees to buy out minority Kx Systems shareholders (Arthur and Janet)
2019 – First Derivatives completes acquisition of the minority shareholdings in Kx Systems, taking the company’s total stake in the business to 100 per cent for $53.8 million (€48m) in cash.
“The deal marks an important milestone for the company”, chief executive Brian Conlon said.
2019-07-28 – Brian Conlon, one of Northern Ireland’s most successful businessmen passes away. (link)
2020-01 – Seamus Keating appointed as CEO
2024-03 – FD Technologies broken into 3 separate firms:
MRP – Marketing (spun off into a merger)
First Derivative consulting arm.
FD Technologies owning the KX software business
2024-12 – FD Technologies plc (LON:FDP) completes sale of First Derivative (consultancy) to EPAM Systems, Inc..
2025-05-08 – Private equity firm TA announced an “All-Cash Offer to Acquire FD Technologies, Owner of Global Real-Time Analytics Leader KX”.
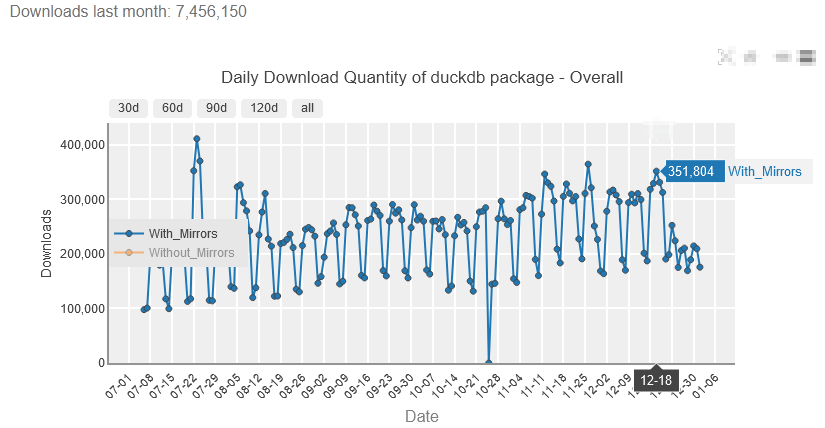
Open source tools are now as performant as pre-existing commercial offerings for data analysis and in many ways offer more features.
Proof: See the time-series benchmarks and note how many are open source: https://www.timestored.com/data/time-series-database-benchmarks
Everyone has discovered that column-oriented storage and vector execution is the secret to fast analytics.
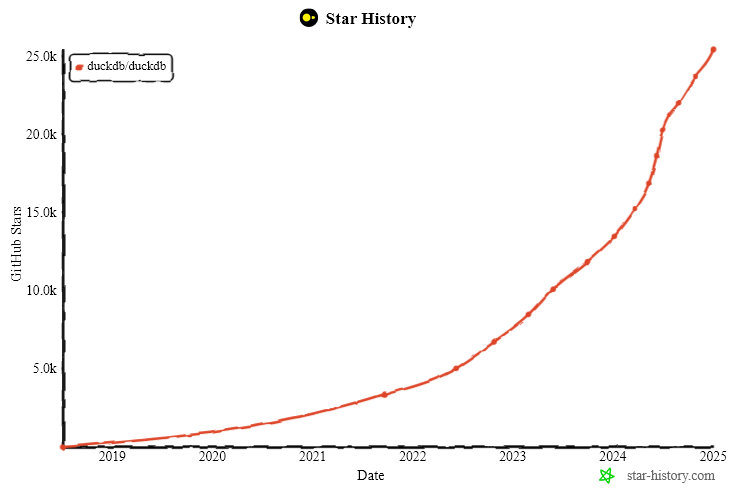
DuckDB is on course to become the defacto column oriented database that all others will be compared to.
Clickhouse conquered a number of enterprises but difficuly deploying and getting started now seem like key factors that held it back.
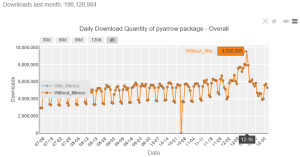
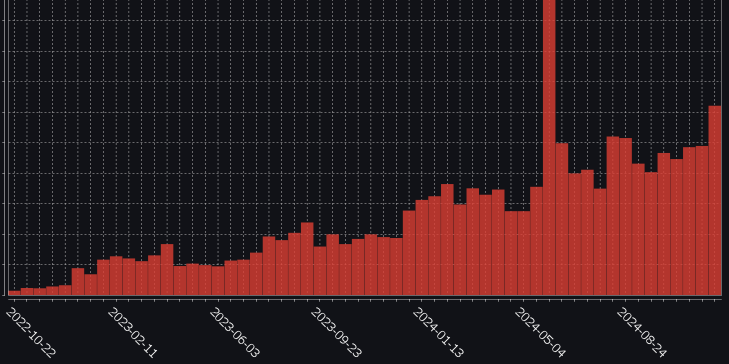
DuckDB Downloads
DuckDB Stars
Underlying Factors
Why has SQL and python won? In many ways these are terrible languages (GIL , SET theory) but they won? I can’t say all the reasons but some things that I believe worked in favour:
Open Source + Free = Hard to beat. We’ve seen open-source companies (license disputes mentioned below) take over every area. VCs and startups have realised making big money selling dev tools requires solving two problems: distribution + technology and the harder one is now distribution. The important thing is getting your product into the hands and heads of as many people as possible. Once there, you can withhold all useful enterprise features and charge for them, assuming AWS doesn’t try the same trick. I do wonder if this is causing the death of otherwise small viable software bsuinesses.
Google = a second brain that worked on keyword search. Languages that had judicial overloading are harder to search than languages with many function names. Google makes it easier to find uniquely named functions that python has. Does anyone still read the manual? nevermind the 500+ page language bibles that were the only way to learn languages 20 years ago?
AI – It hasn’t been a factor to date but AI is similar to the google benefit but even more. The more data and usage, the more chance AI can write your code, write your query etc. Will this reinforce the benefit that fully expanded syntax and popularity already provides? APL could be even more dead than it is already.
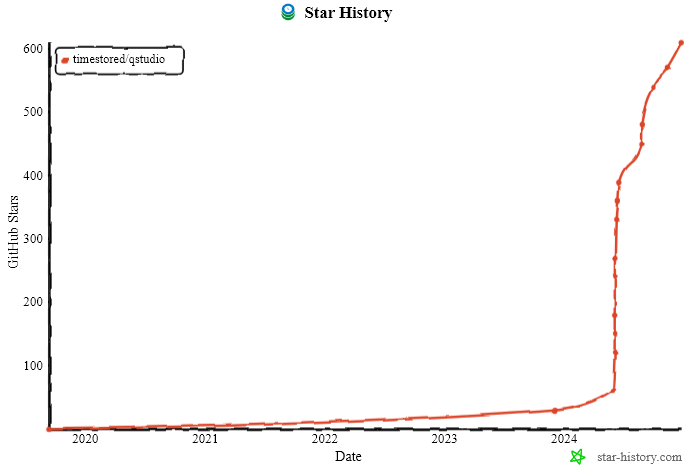
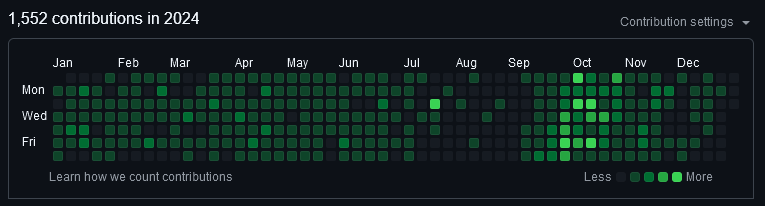
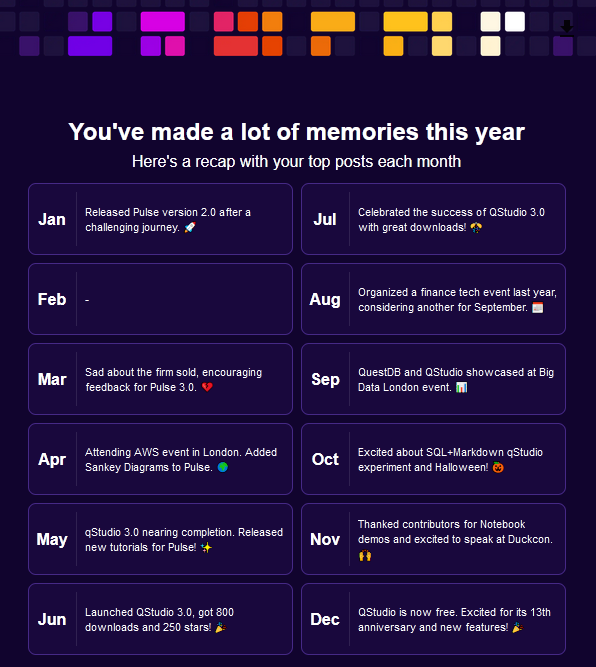
2024 has been a good year with new major versions of both QStudio and Pulse released. 1000s of new users using our tools and we continue to release regularly and keep improving. Thanks go to our users for raising issues, providing feedback and commercially backing us.
QStudio is now 100% Free. No registration or license required.
Why? Are you shutting down?
Quite the opposite, we believe free and open source is the future and that is where we are going.
If anything we want customers to take this as a massive thanks.
Thank you for being part of driving QStudio forward and sponsoring development and cheering us along all these years.
Thanks in particular to
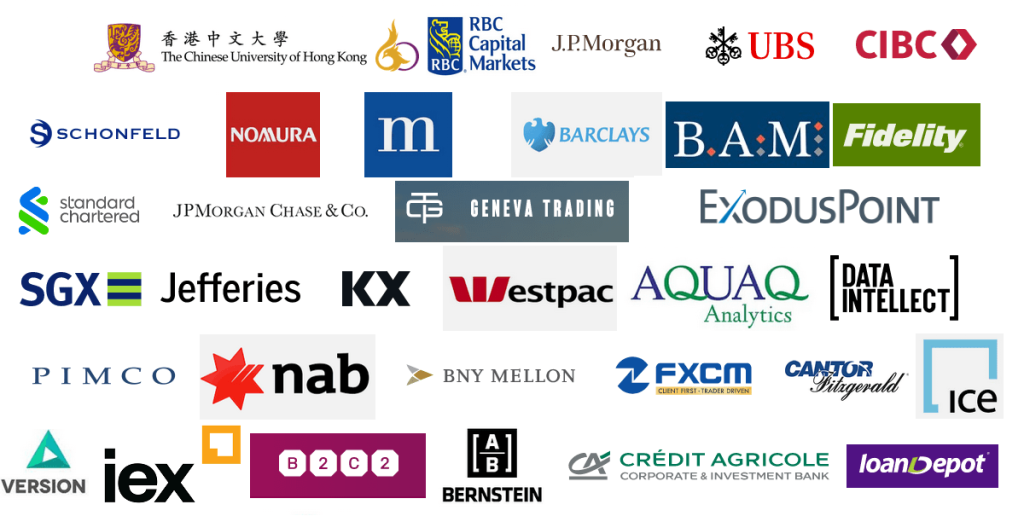
Thanks in particular to the large finance firms that took a chance on us. Big firms can be bureaucratic with onboarding, purchasing policies, vendor lists, 30 page contracts so I want to thanks all those individuals that jumped those hurdles to get us onboarded and those that put it on the corporate credit card. Below this post is an image containing what may or may not be some customers and other firms that have provided feedback, assistance and input over the years. Strictly speaking we are not allowed to confirm nor deny customers.
What I would say as an external party is that on average these places knew how to complete paperwork, get out of staffs way and enable them to get work done so they are probably better places to work on average.
Over the years, a few larger firms failed to onboard as those attempting it were ground down under the paperwork.
The good news for them is that QStudio is now free and the paperwork should be halved!
If you have any bugs, issues or feedback to report please join us on github
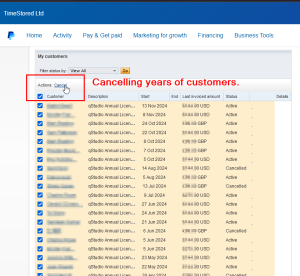
This is me cancelling all the individual users that paid annually for QStudio after 10+ years of building them up! Similarly all corporate contracts are also terminated.
Thanks
Note: For those who recently renewed we are offering a Free Pulse license for 10x the users you purchased for QStudio. Get in touch for a demo.
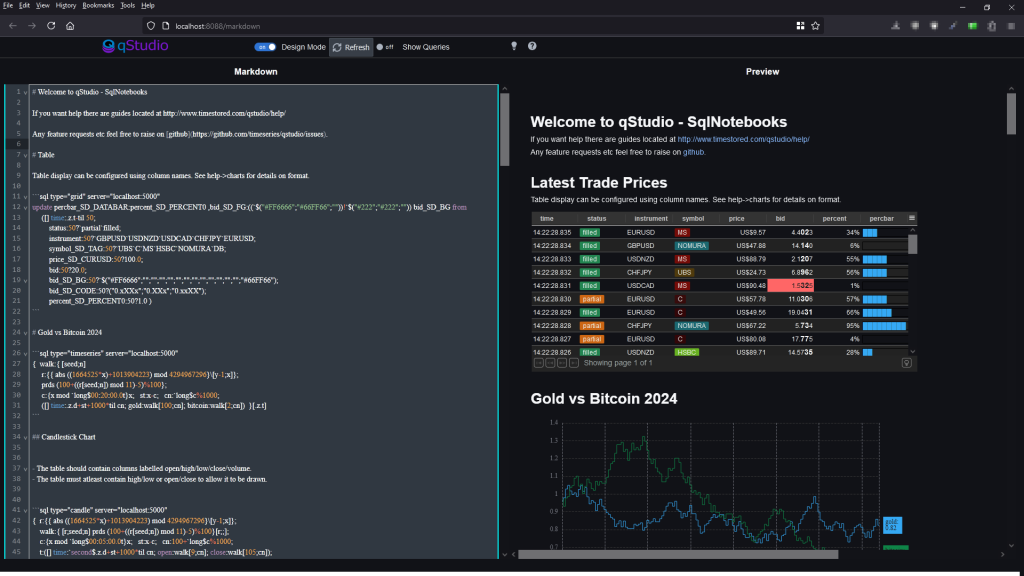
Want to create beautiful live updating SQL notebooks?
While being able to easily source control the code?
and take static snapshots to share with colleagues that don’t have database access?
Today we launched exactly what you need and it’s available in both:
QStudio Version 4 – Desktop SQL Client entirely based on editing markdown files locally.
Pulse Version 3 – As a shared team server, where users only need a web address to get started and share results.
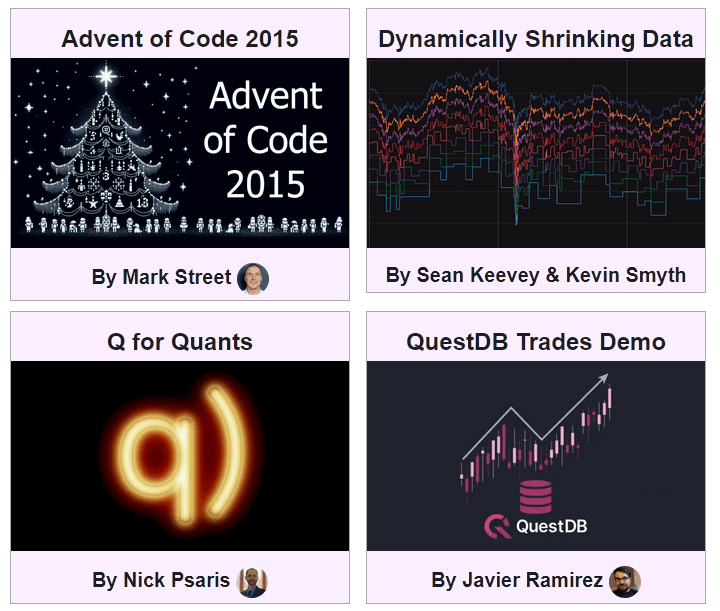
SQL Notebook Examples
We have worked with leading members of the community to create a showcase of examples.
These are snapshotted versions with static data. The source markdown and most the data to recreate them are available on github.
Let us know what you think, please report any issues, feature suggestions or bugs on our github QStudio issue or Pulse issue tracker.
Thanks to everyone that made this possible. Particularly Brian Luft, Rich Brown, Javier Ramirez, Alexander Unterrainer, Mark Street, James Galligan, Sean Keevey, Kevin Smyth, KX, Nick Psaris and QuestDB.
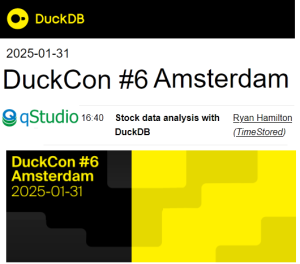
DuckDB has skyrocketed in the last year and Amsterdam is it’s home. QStudio will be there in 2025.
31st January 2025 – 16:40 Stock data analysis with DuckDB
One year ago we decided to bundle DuckDB as we thought it was awesome. A free column oriented database that can open local databases and perform ASOF joins at speed! We knew QStudio users would love it. This year Ryan is excited to be speaking at Duckcon #6 in Amsterdam.
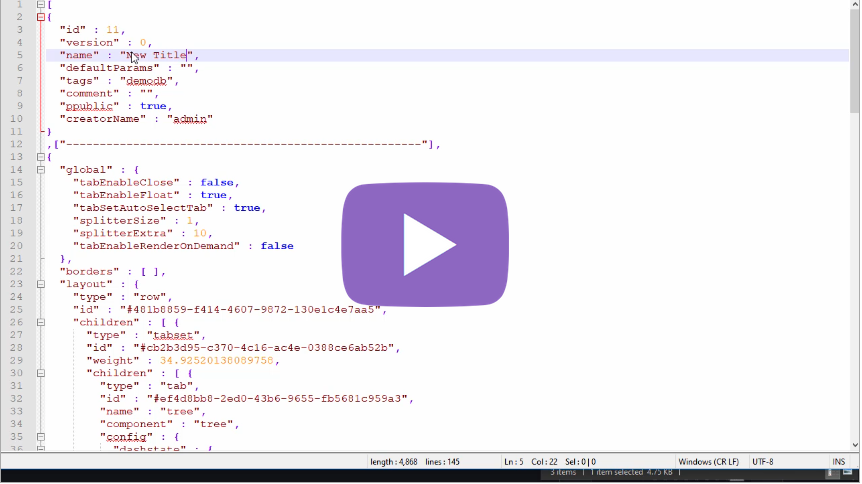
SQL+Markdown qStudio experiment 🚀 🚀 Quick report creation with nice git code commits.
If this is something that interests you, message me.
Particularly if you have tried other notebooks and hold strong opinions 😡 .
At TimeStored we are constantly running experiments with both Pulse and qStudio with small groups of users to see what new ideas may provide value. Most fail. They don’t always work out or they don’t gather enough interest to be viable but we think SQLMarkdown might be a winner. We are already finding it useful for our own workflows.
In 1998 kdb+ was released and changed the finance database industry. We want to do it again.
Today we are releasing kdb+ 5.0 that Works Easily for Everyone, Everywhere, with Everything.
A Data Platform that Easily Works for
Everyone – Is the most user friendly q ever
Everywhere – Finance and beyond
Works with Everything
Works with every major database tool seamlessly.
Interoperates with R/Python and almost every major data tool using high speed standards
The Past – What we have done
15 years ago we had a product that was light years ahead of our competition. When you download q today it looks fundamentally similar to how it looked then. Users are presented with a bare q prompt and left to create a tickerplant, a framework and various parts themselves to get real work done.
The landscape has changed and we need to change faster with it. Today we address that. How?
1. We are going to listen and embed ourselves with customers. Pierre and Oleg have been sitting and working with kdb teams at every major bank and hedge fund. They have seen the problems that are being solved, what amazing work those teams have done and where we can improve the core to help them.
2. We are working with the community. Data Intellect invented the marvellous Torq framework, Jo Shinonome has created Kola, Daniel Nugent wrote a wonderful testing framework and numerous others have written useful q modules. They’ve written some great useful components and provided us with lots of insight.
3. We are learning from the competition. Andrew and Ashok have gone round every database and technology similar to ours and examined their strengths and weaknesses. They coded on each and have found some amazing parts but going further they have looked at how those businesses operate and how they attract users.
The Past
Previously. Someone downloaded kdb then needed to email us to use commercially and wait months for their company to negotiate a contract.
Previously. Someone starting with kdb has to recreate a lot of the framework work teams in banks have done and they have to discover and adapt the wonderful work the community has done. We want to unleash that creativity.
Previously. Someone trying to use kdb with tableau, pulse, java, c# has to learn our own driver and struggle to get it to communicate.
Previously. Someone trying to write queries has to write qSQL.
Today we are releasing an amazing version of kdb+ that Works Easily for Everyone, Everywhere with Everything.
Everyone = Modules
Today: We are revealing a Module Framework built into kdb+. This is going to make it easier for everyone to get started.
Bringing the current enterprise quality code to everyone AND enabling existing community contributions to be reused easily.
The great news is, we’ve worked with partners to already have production quality modules available from day zero:
The framework is documented and public, so you can even load modules from github or your own git URL. (This has required making namespaces stricter to prevent one module from being able to affect another. No more IPC vs local loading oddities). Kdb now ships with a packaging tool called qpm based on concepts similar to NPM.
This will allow both KX and the community to experiment in modules and if successful to integrate those libraries into core.
It will allow you to get up and running with kdb+ faster, at less cost and receive production quality maintenance and feature updates for larger parts of your stack.
Everyone = SQL = Becoming as SQL compatible as possible.
Before – piv:{…….} ij -100 sublist.
Example: Select *
Example: Select * from t inner join v LIMIT 50
Example: Pivot using duckdb notation
Example: sums, prods, finance functions.
Query it as if standard postresql database – The old driver is loadable via module.
Partitioned databases now all “date=…” to be placed anywhere in the query. If it’s not a nice clear error message is sent.
q)select * from partitionedtable where (price<10) AND (date=.z.d)
q)PIVOT Cities ON Year USING first Population as POP,Population as P
Country	Name	    | 2000_POP	2000_P	2010_POP	2010_P	2020_POP	2020_P
--------------------|----------------------------------------------------------------------
NL	Amsterdam     | 1005	[1005]	1065	[1065]	1158	[1158]
US	Seattle	      | 564	[564]	608	[608]	738	[738]
US	New York City | 8015	[8015]	8175	[8175]	8772	[8772]
With Everything = Postgres Wire Compatible
We’ve listened to user problems with ODBC, tableau, kx drivers over the years and we are now bundling pgwire compatibility within the default kdb engine.
Anything that bundles a postgres driver will now work with kdb+.
With Everything = PyArrow + Parquet
Select from and save to a wide range of open standards: parquet, arrow, delta lake, iceberg.
q)select * from file.parquet
q)select * from s3://blah.com/foo
q)select * from http://homer.internal/data.csv
q)`:asd.parquet 0: table
`:asd.parquet
This will provide: runtime checking, optimization of code and we’ve worked with qStudio and vs code to automate checks in the UI.
Previously
You had to spend months getting kdb+, then setting it up and building a platform, integrating it with other systems, finding experts.
Today
Download, reuse the existing modules, it works with all existing tools, and the greater SQL and typing support allows more people to safely run queries.
Works Easily for Everyone, Everywhere with Everything.
Everyone = friendlier SQL, type hints, more functions builtin including PIVOT.
With modules to allowing greater community contribution and reuse.
One Last Thing: Everywhere = We are releasing the 32 bit version of q FREE for all usages including commercial.
Disclaimer: The above is entirely fictional based on some wishes of the author, no proprietary information is known nor being shared. If you like the ideas let KX know. If you dislike the ideas, let me know and post your thoughts for improvement.

 In 1998 kdb+ was released and changed the finance database industry. We want to do it again.
 Today: We are revealing a Module Framework built into kdb+. This is going to make it easier for everyone to get started.

If this is something that interests you, message me.
Particularly if you have tried other notebooks and hold strong opinions 😡 .