Chart Click Events
Interactive Chart Click
Clicking on a chart:
- Can run user specified Event Handlers
- Populates Variables that can be used
Chart Click Event Handlers
Event Handlers allow specifying SQL to run and URLS to open when a chart is clicked.
Chart Click Variables
Depending on the chart type and where a user clicks, four variables may be populated:
| Variable | Description |
|---|---|
| ts | TimeStamp. The point in time that the user clicked at. e.g. on Time-Series graph, the point along the x-axis. |
| name | Name of the value represented. e.g. When you click a bar on a bar chart, it will use the row-label. |
| series | The series name. e.g. When you click a bar on a bar chart, it will use the column header. |
| val | The numeric value represented by this bar/line. |
Variables can then be used by referring to their key within SQL queries by using either ((keyName)) or {{keyName}}.
When those variables are populated the queries automatically get ran and the displays updated.
Note, the editor panel contains a "key prefix" setting, this allows the author to add a prefix to the variable names to allow avoiding collisions between charts.
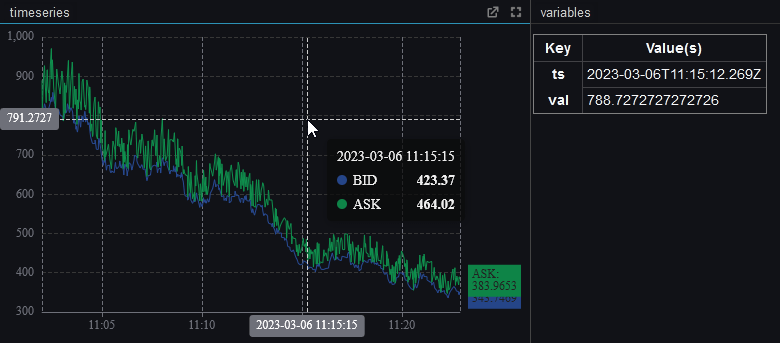
Example Time-Series Graph
Clicking a time-series graph sets the values ts to the timestamp, val to the y-axis value.
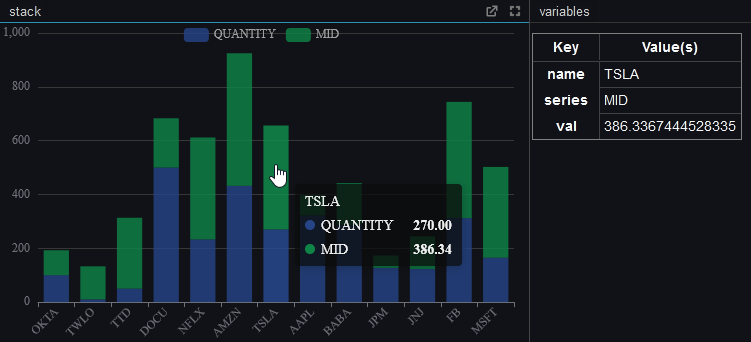
Example Bar Chart
Clicking the bar on a bar chart, sets name to the x-axis label, series to the legend label, val to the selected numeric value.