
DepthMap Charts
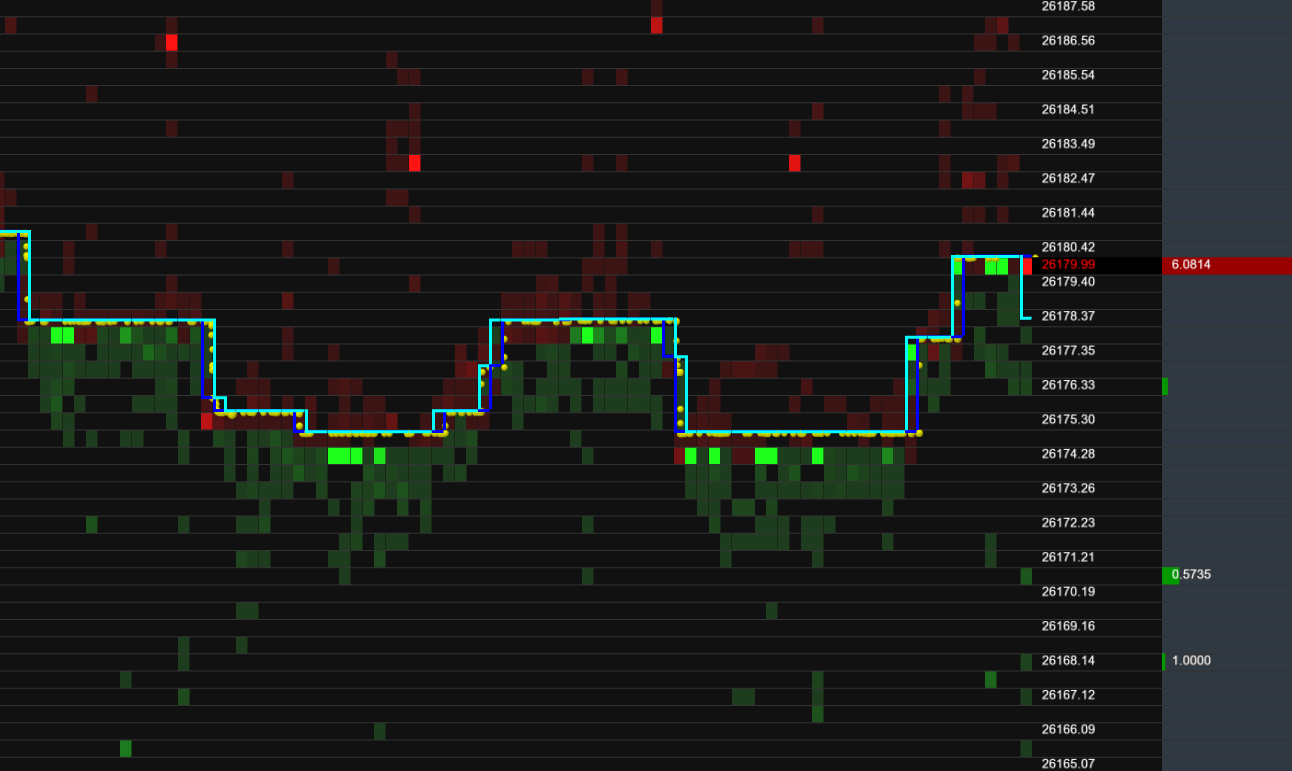
DepthMap charts are a highly specialized visualization for showing level 2 market data. If the data is supplied in a particular format, the current price/size spread over time will be shown as a heatmap like so:
Components
| Component | Description |
|---|---|
| Y-Axis | e.g. 26166 to 26186 on the above image is the price level. This is bitcoin data where most of the quoted prices are around 26170. |
| X-Axis | Time. The rightmost point represents the latest incoming data (usually now). |
| Red Squares | Ask prices, where the red shading represents the size. |
| Green Squares | Bid prices, where the green shading represents the size. |
| Chart Lines | Represent the bid/ask at the top of the book. |
| Yellow Circles | Represent trades that occurred. Their size represents the quantity. |
| Rightmost column with colored bars. | Represent the latest order book received as a bar chart. With the length of bar being the size. |
Specialized Appending
The DepthMap is a highly specialized visualization intended to receive fast appending streams of data and to display that data in real-time. To achieve this, the Depthmap expects incoming data to be appended to previously received data. i.e. If your component is polling, the latest poll result is appended to the previous.