TAQ Trade & Quote Chart
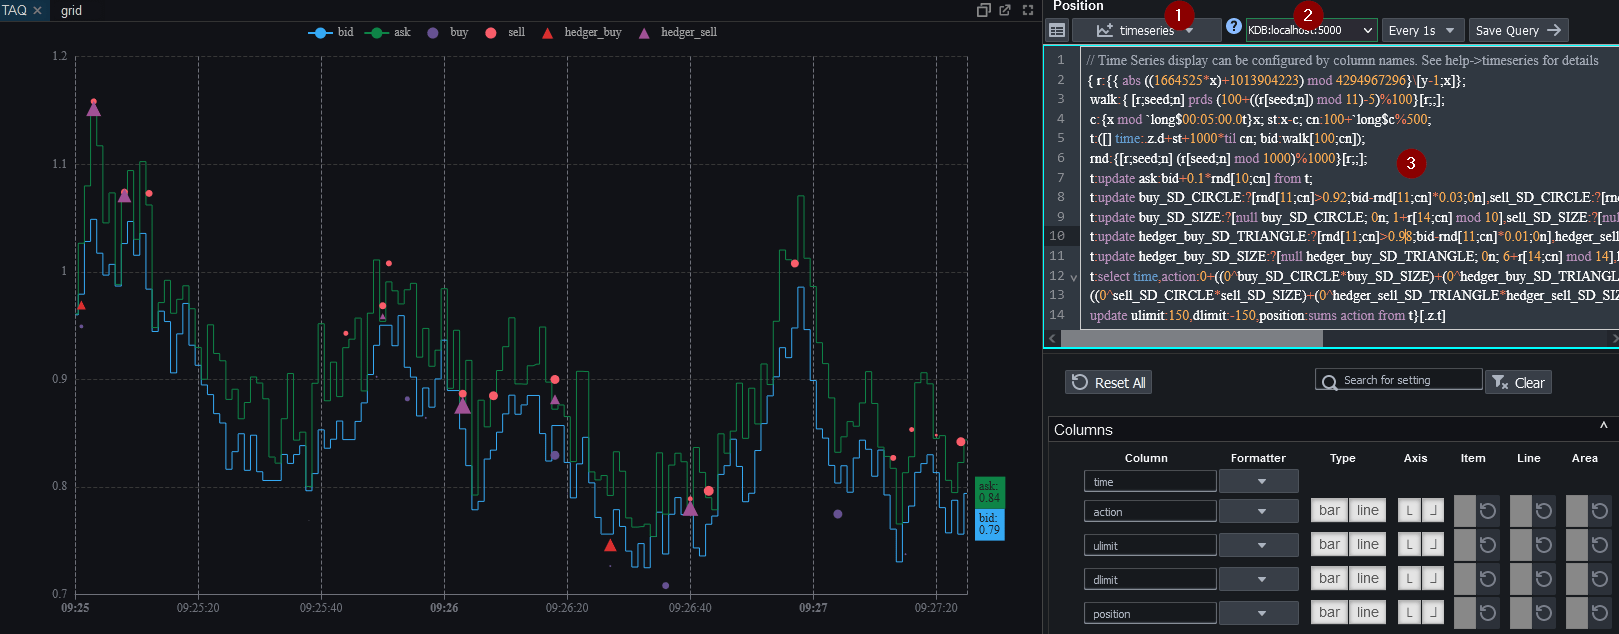
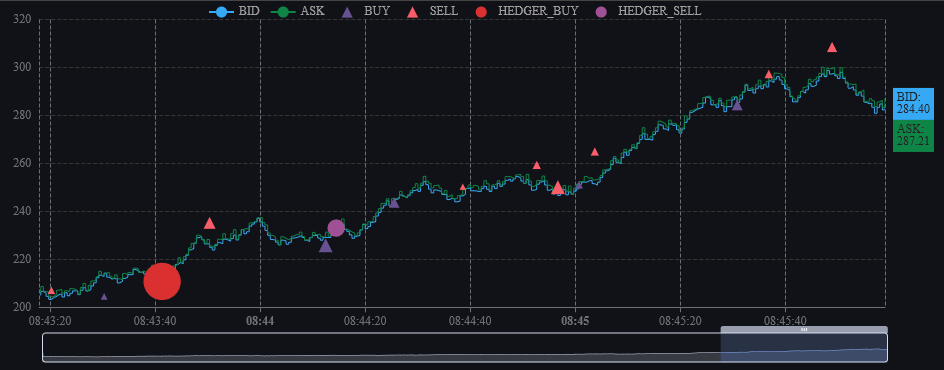
Pulse has particularly good support for finance charts. The below image shows a time-series chart displaying:
- Bid/Ask Lines - A two-way price quotation representing the highest price a buyer will pay for a security and the lowest price a seller will take for it.
- Triangles - Representing client trades, the position is the price executed at and the radius is proportional to the quantity of the trade.
- Circles - Represent hedger trades. To maintain an acceptable risk position given client trades.
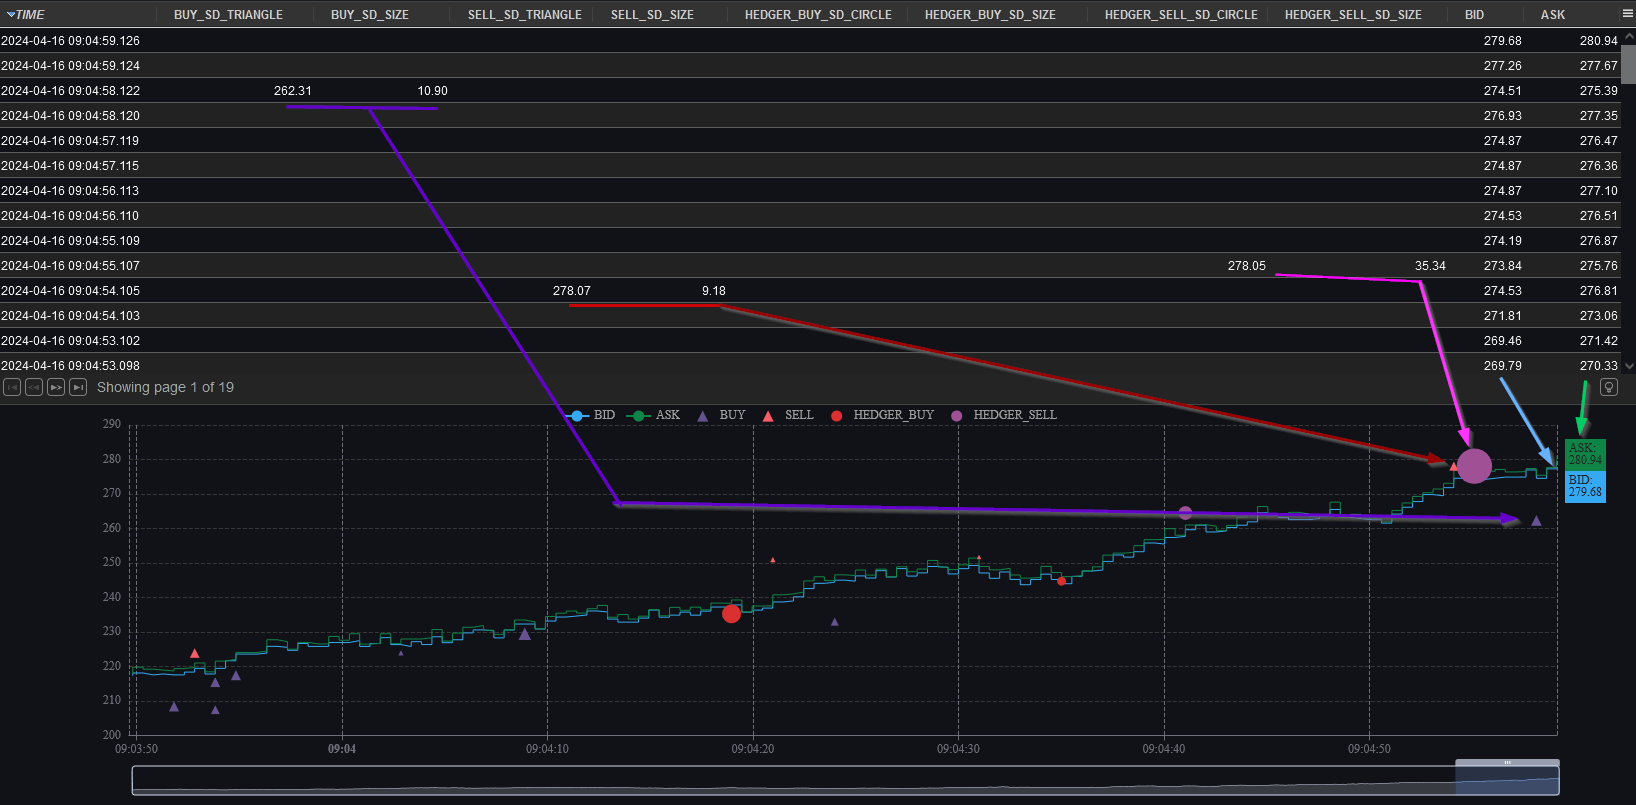
Example TAQ Table
To generate such a chart, we use specially named columns to control the appearance as shown below. The table must:
- Contain atleast one date or time column.
- Any plainly named columns e.g. Bid/Ask - will by default be rendered as a line.
- Specially named COL_SD_SHAPE COL_SD_SIZE - columns can be used to generate scatter points at that location with a given size.
- For example the column pair
BUY_SD_TRIANGLE BUY_SD_SIZEgenerate the purple triangles that together represent BUY.
Configuration Explained
You can configure the appearance of a column by adding an _SD_FORMATTER at the end of the column name.
For example if a column was call itemPrice, you could name it itemPrice_SD_CIRCLE to show the chart without a line and instead showing circle markers. Additionally you could add a column named: itemPrice_SD_SIZE to set the size of the circle/symbol.
| Area | Example | Options | Description |
|---|---|---|---|
| Shape | _SD_CIRCLE | CIRCLE, RECT, ROUNDRECT, TRIANGLE, DIAMOND, PIN, ARROW, NONE | The shape to use for displaying points in the chart. |
| Shape Size | _SD_SIZE | Number 1-99 | The size of the shape to use for displaying points in the chart. You MUST have set an SD_SHAPE first. |
Example Queries
BabelDB Example Query: