Table Summary Row
The AGrid component supports an optional Summary Row that displays summary statistics (such as sum, average, min, max, count, etc.) for each column. The summary row is calculated dynamically based on the currently visible rows, meaning it respects filtering.
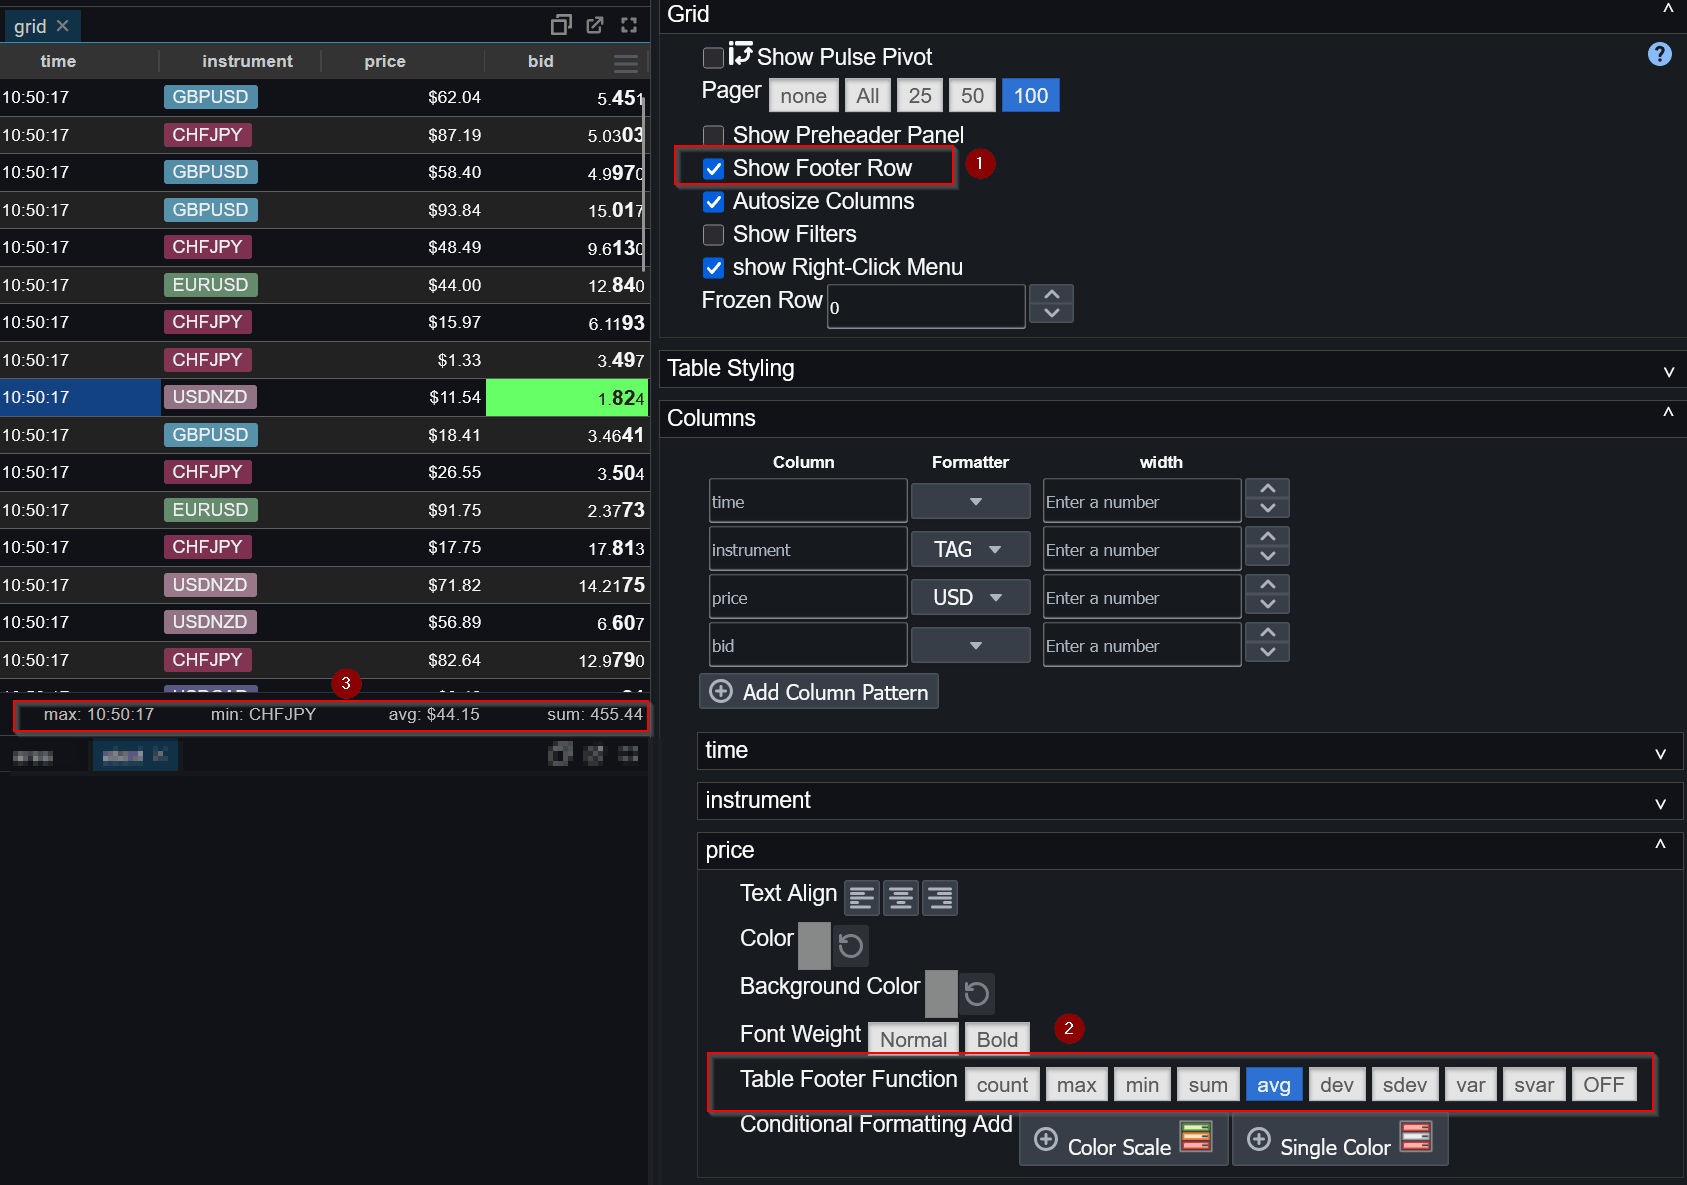
Enabling the Summary Row
The summary row is controlled at the grid level.
To enable it, turn on the showFooterRow option in the Grid configuration.
Column Aggregators
Once the summary row is enabled, each column may independently specify
which aggregation function it should display.
This is configured per column using the Table Footer Function setting.
If no reducer is specified, the column footer will remain empty.
Supported Aggregators
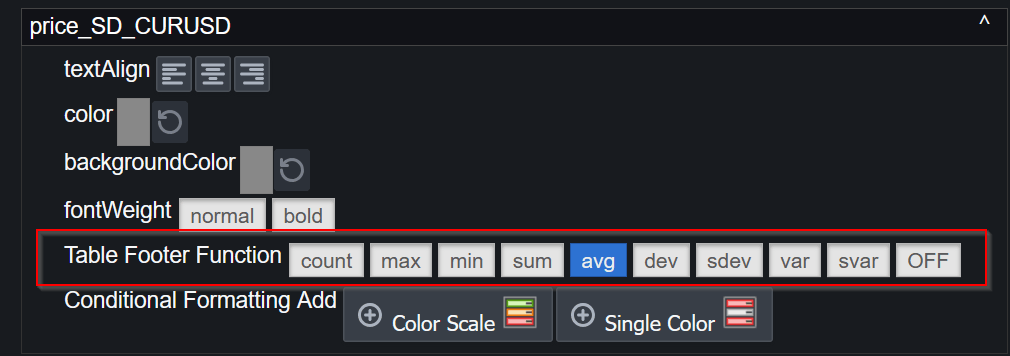
| Reducer | Description |
|---|---|
| sum | Total of all numeric values in the column |
| avg | Average (mean) of numeric values |
| min | Minimum value in the column |
| max | Maximum value in the column |
| count | Total number of rows, including null values |
| dev | Population standard deviation |
| sdev | Sample standard deviation |
| var | Population variance |
| svar | Sample variance |
Filtering, Sorting & Paging
The summary row always reflects the current table view:
- Only visible rows are included in calculations
- Filters reduce the rows used for aggregation
- Sorting has no effect on results
This ensures summary statistics remain accurate and intuitive while users interact with the table.
Numeric vs Non-Numeric Columns
Aggregations such as sum, avg, and variance metrics
only apply to numeric columns.
For non-numeric columns: Numeric aggregations return no value. Count remains valid. Min/Max return based on alphabetical sorting.
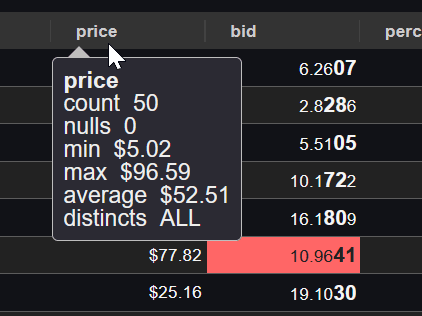
Table Head Tooltip
Similar statistics are shown when a user hovers a column header.